

TPR slides over 4% as technical indicators signal continued weakness despite positive quarterly results

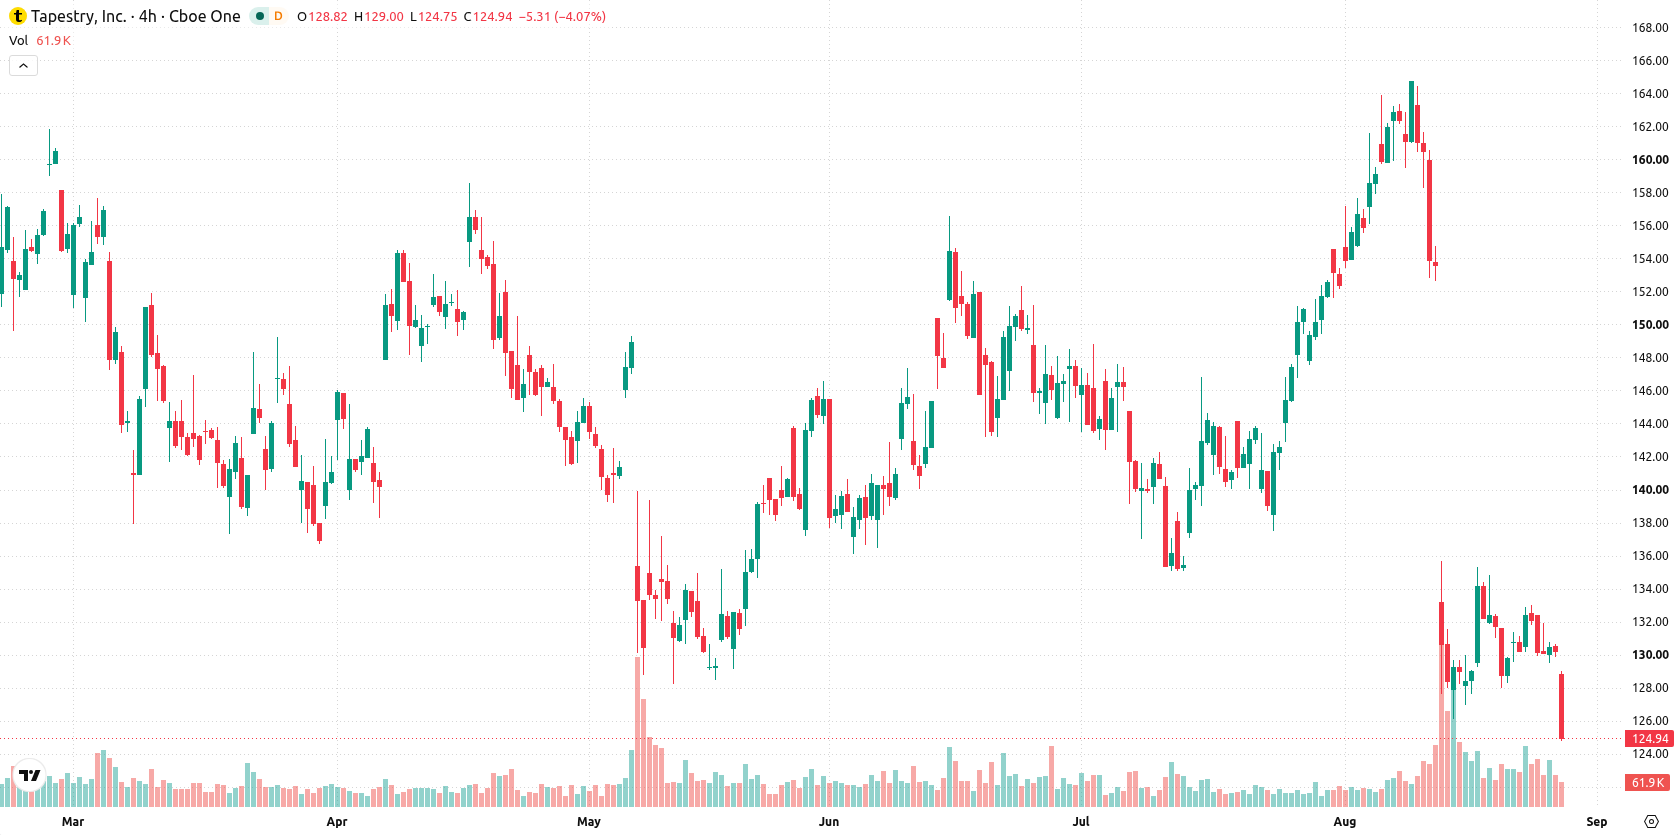
Tapestry Inc (TPR) fell 4.21% as persistent selling pressure dominated, even as recent institutional investments and a quarterly dividend announcement provided a supportive corporate backdrop. The decline is reinforced by TPR trading well below its 20-, 50-, and 200-day moving averages, reflecting continued downside momentum.
 133.09
137.25
Highlights
- Tapestry stock delivered quarterly earnings per share of $1.32 and revenue of $1.88 billion, both above analyst forecasts.
- Strategic Global Advisors LLC, Freestone Grove Partners LP, and Proficio Capital Partners LLC added new positions in Tapestry during the second quarter.
- Shares of Tapestry trade well below key moving averages with strong bearish momentum, expected to range $123.04 to $130.57 and a high probability of further downside.
Institutional buying and earnings beat fail to shift bearish sentiment
Several institutional investors acquired new positions in Tapestry during the second quarter, including Strategic Global Advisors LLC, Freestone Grove Partners LP, and Proficio Capital Partners LLC. The company released a quarterly earnings report with earnings per share of $1.32 and revenue of $1.88 billion, both exceeding analyst expectations. Tapestry also announced a quarterly dividend of $0.4625 per share, though price action has remained under broader selling pressure.
Oversold signals deepen as momentum and technical thresholds break down
Tapestry is trading well below its 20-day, 50-day, and 200-day moving averages ($144.10, $144.21, and $137.64, respectively), signaling downside pressure for the short, medium, and long term. The near-term ceiling is identified at $129.53, with a near-term floor at $123.04. Long-term alignment trends remain bullish based on the 50-day versus 200-day moving averages. Momentum indicators show continued selling pressure: the MACD remains negative, the ADX is neutral, and the RSI stands at 36.06 with a 'Sell' signal. Oversold conditions are reinforced by both the Stochastic RSI and the Commodity Channel Index. The Bull/Bear Power (BBP) at -5.08 confirms dominant selling for intraday action, with an 'Oversold' reading. Intraday volatility is 0.97%, and the stock is currently close to the low end of today's trading range, reflecting sustained bearish tone after the open.
Earlier, analysts noted that despite record financial results and strong brand momentum for Tapestry, the stock continued to exhibit persistent downside risk. The current price action, reinforced by new institutional activity and further sell signals, underscores an ongoing bearish scenario, making the $123.04 support a key level for traders to monitor in the days ahead.






Latest Tapestry Inc News




-
 Afghanistan
-
 Albania
-
 Algeria
-
 Angola
-
 Argentina
-
 Armenia
-
 Australia
-
 Austria
-
 Azerbaijan
-
 Bahamas
-
 Bahrain
-
 Bangladesh
-
 Belarus
-
 Belgium
-
 Bolivia
-
 Botswana
-
 Brazil
-
 Brunei
-
 Bulgaria
-
 Cambodia
-
 Cameroon
-
 Canada
-
 Chile
-
 China
-
 Colombia
-
 Congo
-
 Costa Rica
-
 Cote d'Ivoire
-
 Croatia
-
 Cuba
-
 Cyprus
-
 Czechia
-
 DR Congo
-
 Denmark
-
 Dominican Republic
-
 Ecuador
-
 Egypt
-
 El Salvador
-
 Estonia
-
 Eswatini
-
 Ethiopia
-
 Finland
-
 France
-
 Georgia
-
 Germany
-
 Ghana
-
 Greece
-
 Haiti
-
 Hong Kong
-
 Hungary
-
 India
-
 Indonesia
-
 Iran, Islamic republic
-
 Iraq
-
 Ireland
-
 Israel
-
 Italy
-
 Jamaica
-
 Japan
-
 Jordan
-
 Kazakhstan
-
 Kenya
-
 Korea
-
 Kuwait
-
 Kyrgyzstan
-
 Laos
-
 Latvia
-
 Lebanon
-
 Lesotho
-
 Libya
-
 Lithuania
-
 Luxembourg
-
 Madagascar
-
 Malaysia
-
 Malta
-
 Mauritius
-
 Mexico
-
 Moldova
-
 Mongolia
-
 Montenegro
-
 Morocco
-
 Mozambique
-
 Myanmar
-
 Namibia
-
 Nepal
-
 Netherlands
-
 New Zealand
-
 Nigeria
-
 North Macedonia
-
 Norway
-
 Oman
-
 Pakistan
-
 Palestine
-
 Panama
-
 Papua New Guinea
-
 Paraguay
-
 Peru
-
 Philippines
-
 Poland
-
 Portugal
-
 Puerto Rico
-
 Qatar
-
 Reunion
-
 Romania
-
 Rwanda
-
 Saudi Arabia
-
 Serbia
-
 Singapore
-
 Slovakia
-
 Slovenia
-
 Somalia
-
 South Africa
-
 Spain
-
 Sri Lanka
-
 Sweden
-
 Switzerland
-
 Syria
-
 Taiwan
-
 Tajikistan
-
 Tanzania
-
 Thailand
-
 Trinidad and Tobago
-
 Tunisia
-
 Turkey
-
 UAE
-
 Uganda
-
 Ukraine
-
 United Kingdom
-
United States
-
 Uruguay
-
 Uzbekistan
-
 Venezuela
-
 Vietnam
-
 Yemen
-
 Zambia
-
 Zimbabwe
- Forex
- Crypto












