

Johnson & Johnson stock trades below 20-day average as technical signals clash: weekly analysis

Shares of Johnson & Johnson (JNJ) are trading near $267 after falling nearly 3% this week as the decline stretches into oversold territory. The daily chart highlights conflicting momentum signals, pointing to underlying uncertainty and two-way action. This technical setup leaves the outlook mixed heading into the week ahead.
 271.07
277.73
Highlights
- Shares of Johnson & Johnson fell 2.69% over the past week and now trade at $267.28 near key support.
- The stock remains above its longer-term moving average, but the short-term trend has weakened and volatility is elevated at 3.98%.
- Forecast for the week ahead is trade in a $262.52 to $275.69 range, with 62% probability of an upside move if $269.05 is cleared.
Mixed fund flows and dividend boost as institutions reposition around JNJ
Institutional activity was in focus as Quantitative Investment Management LLC sharply reduced its stake in JNJ by 93.3% in the second quarter, according to a MarketBeat report on September 10, 2026. Meanwhile, Canada Pension Plan Investment Board increased its position by 16.3%, while several other funds, including Equitable Holdings Inc. and Jefferies Financial Group Inc., trimmed their exposure. On the operational side, JNJ extended its track record of dividend growth with a 3.1% year-over-year increase in its June 2026 payment, according to AOL.
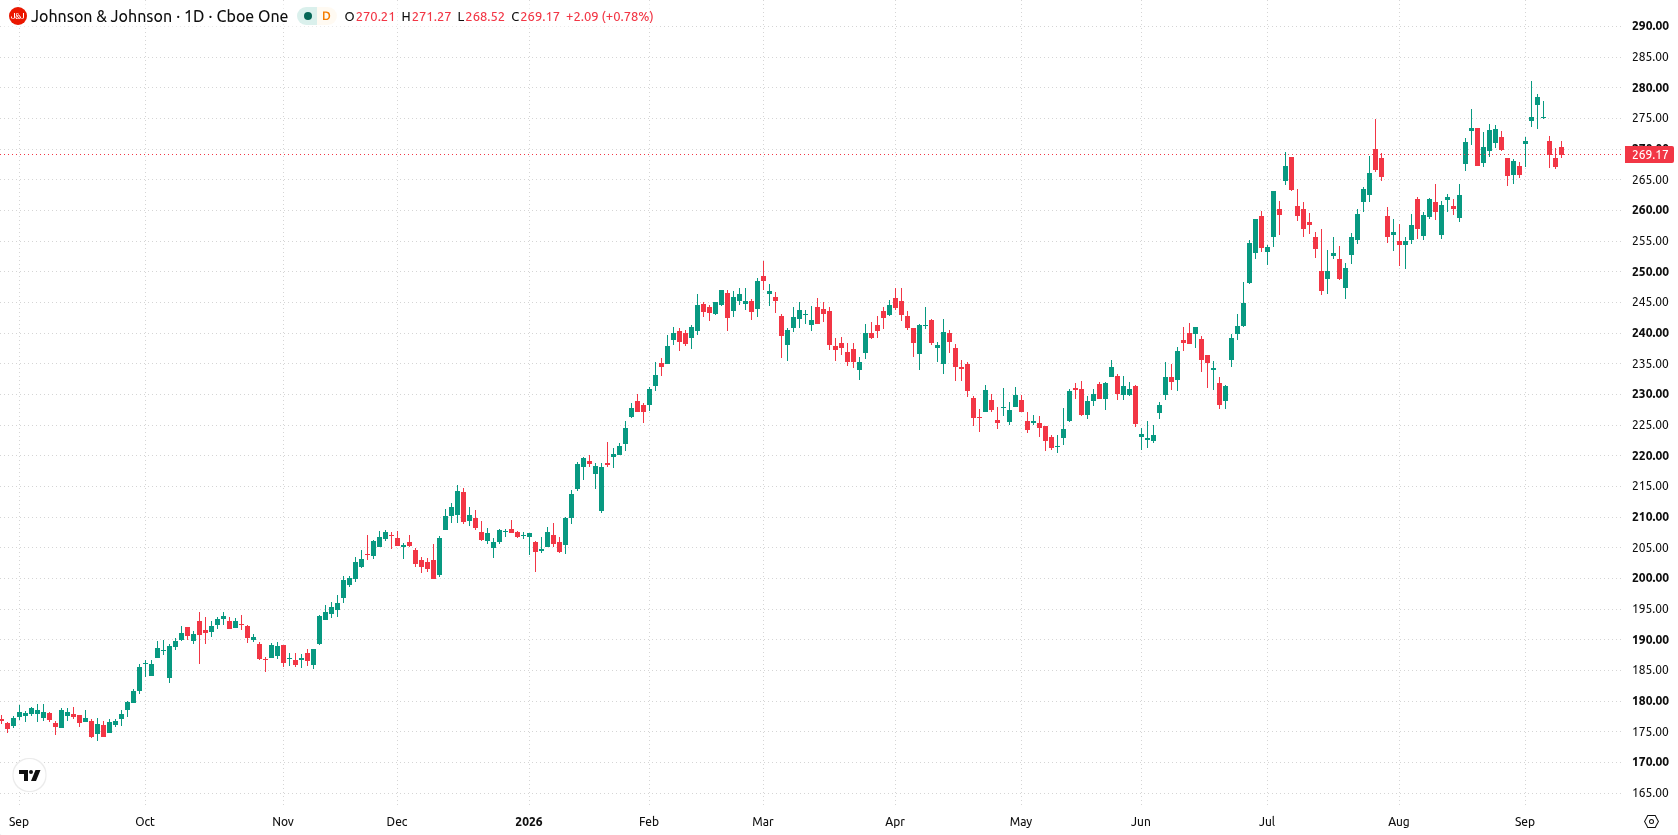
Divergent technicals shape weekly outlook as volatility remains elevated
On the daily chart, the setup shows price action pinned to key support at $266.78 and hovering just below the MA-20, with a developing trend and 3.98% volatility over the past seven days. Momentum signals are split: the Stochastic RSI is deeply oversold at 0, hinting at early bullish potential, but the HMA forecast points to further declines. The MACD, with a strong buy direction, clashes with the short-term weakness, confirming a lack of consensus. Immediate resistance is at $269.05, while support is reinforced at $266.78 and by the Kijun at $264.65.
Two-way action favored next week unless support or resistance breaks
In the week ahead, Johnson & Johnson shares are expected to trade between $262.52 and $275.69. The probability of an increase sits at 62%, with a 38% chance of a decline. The base case is for continued two-way action inside this range. A close above $269.05 would open room for a bullish bounce toward the upper end, while a drop through $266.78 could see the move lower deepen toward the expected range floor.
Earlier, analysts noted that Johnson & Johnson's recovery was supported by robust fundamentals and continued dividend consistency. The mixed technical signals and shifting institutional activity highlighted in the current article add nuance to that outlook, with near-term direction hinging on whether shares can hold support above $266.78.






Latest Johnson & Johnson News





-
 Afghanistan
-
 Albania
-
 Algeria
-
 Angola
-
 Argentina
-
 Armenia
-
 Australia
-
 Austria
-
 Azerbaijan
-
 Bahamas
-
 Bahrain
-
 Bangladesh
-
 Belarus
-
 Belgium
-
 Bolivia
-
 Botswana
-
 Brazil
-
 Brunei
-
 Bulgaria
-
 Cambodia
-
 Cameroon
-
 Canada
-
 Chile
-
 China
-
 Colombia
-
 Congo
-
 Costa Rica
-
 Cote d'Ivoire
-
 Croatia
-
 Cuba
-
 Cyprus
-
 Czechia
-
 DR Congo
-
 Denmark
-
 Dominican Republic
-
 Ecuador
-
 Egypt
-
 El Salvador
-
 Estonia
-
 Eswatini
-
 Ethiopia
-
 Finland
-
 France
-
 Georgia
-
 Germany
-
 Ghana
-
 Greece
-
 Haiti
-
 Hong Kong
-
 Hungary
-
 India
-
 Indonesia
-
 Iran, Islamic republic
-
 Iraq
-
 Ireland
-
 Israel
-
 Italy
-
 Jamaica
-
 Japan
-
 Jordan
-
 Kazakhstan
-
 Kenya
-
 Korea
-
 Kuwait
-
 Kyrgyzstan
-
 Laos
-
 Latvia
-
 Lebanon
-
 Lesotho
-
 Libya
-
 Lithuania
-
 Luxembourg
-
 Madagascar
-
 Malaysia
-
 Malta
-
 Mauritius
-
 Mexico
-
 Moldova
-
 Mongolia
-
 Montenegro
-
 Morocco
-
 Mozambique
-
 Myanmar
-
 Namibia
-
 Nepal
-
 Netherlands
-
 New Zealand
-
 Nigeria
-
 North Macedonia
-
 Norway
-
 Oman
-
 Pakistan
-
 Palestine
-
 Panama
-
 Papua New Guinea
-
 Paraguay
-
 Peru
-
 Philippines
-
 Poland
-
 Portugal
-
 Puerto Rico
-
 Qatar
-
 Reunion
-
 Romania
-
 Rwanda
-
 Saudi Arabia
-
 Serbia
-
 Singapore
-
 Slovakia
-
 Slovenia
-
 Somalia
-
 South Africa
-
 Spain
-
 Sri Lanka
-
 Sweden
-
 Switzerland
-
 Syria
-
 Taiwan
-
 Tajikistan
-
 Tanzania
-
 Thailand
-
 Trinidad and Tobago
-
 Tunisia
-
 Turkey
-
 UAE
-
 Uganda
-
 Ukraine
-
 United Kingdom
-
United States
-
 Uruguay
-
 Uzbekistan
-
 Venezuela
-
 Vietnam
-
 Yemen
-
 Zambia
-
 Zimbabwe
- Forex
- Crypto












