

Johnson & Johnson shares weekly forecast: Upward momentum persists with strong MACD signals

Shares of Johnson & Johnson (JNJ) are trading near $276, extending their recovery with a gain of almost 3% over the past week as investors remain attracted by the stock's defensive appeal and dividend history. With momentum improving, traders will watch for signs of stretched conditions or potential consolidation in the coming days.
 257.46
264.13
257.46
264.13
Highlights
- Shares of Johnson & Johnson gained 2.88% over the past week, closing at $275.77 with sustained bullish momentum.
- The stock remains above key medium and long-term support levels at $271.91 and $263.46, underpinned by strong momentum readings.
- Expected trading range for the upcoming week is $258.82 to $279.31, with over 80% probability of an increase and less than 20% probability of a decrease.
institutional inflows and record dividend streak underpin positive sentiment this week
JNJ continues to draw interest for its robust dividend, as Yahoo Finance and The Motley Fool highlighted another annual increase in April 2026, marking an impressive 64 years of consecutive dividend hikes. On September 2, 2026, Defense World reported Advisors Capital Management LLC raised its position in JNJ stock, reflecting continued institutional confidence. According to ad-hoc-news.de, the company also strengthened its fundamentals with solid free cash flow and a cash position of about $21 billion at the end of Q2 2026.
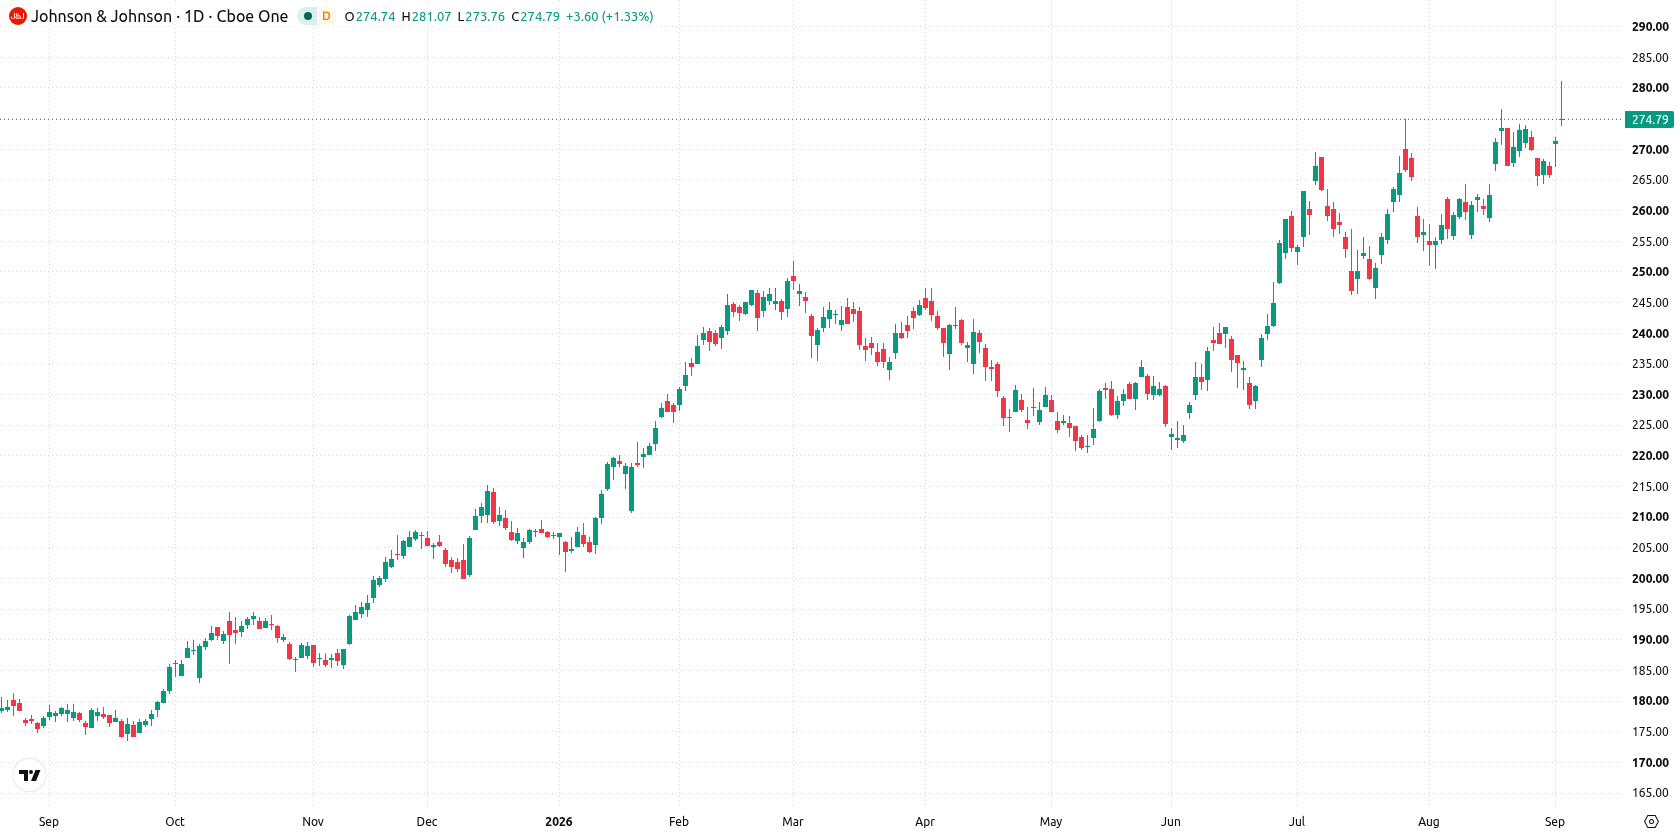
upward momentum grows as technical signals support further advance this week
On the daily chart, the structure points to an emerging move higher that is not yet confirmed, supported by strong readings from the MACD and HMA. Volatility over the past week came in at 3%. The stock remains above its nearest support at $271.91, with $263.46 from the Ichimoku Kijun also acting as a practical support level. Despite neutral readings from zone-based oscillators, momentum is tilted upwards, but consolidation may occur before a clear directional follow-through.
bullish bias prevails with upside breakout risk in the coming week
In the week ahead, the expected range is $258.82 to $279.31. There is a very high probability (more than 80%) of an increase, with only a very low probability (less than 20%) of a decrease. The base case calls for price action to hold above $271.91, targeting a move toward the upper end of the range. A bullish scenario unfolds if shares break above $279.31, while a sustained drop below $271.91 opens the door to a pullback toward $263.46.
Earlier, analysts noted that Johnson & Johnson's recovery was underpinned by upgraded guidance and renewed institutional buying interest. The current analysis further reinforces this positive trajectory, highlighting robust fundamentals and dividend consistency, with the key level to monitor now set at a potential breakout above $279.31.





Latest Johnson & Johnson News






-
 Afghanistan
-
 Albania
-
 Algeria
-
 Angola
-
 Argentina
-
 Armenia
-
 Australia
-
 Austria
-
 Azerbaijan
-
 Bahamas
-
 Bahrain
-
 Bangladesh
-
 Belarus
-
 Belgium
-
 Bolivia
-
 Botswana
-
 Brazil
-
 Brunei
-
 Bulgaria
-
 Cambodia
-
 Cameroon
-
 Canada
-
 Chile
Chile
-
 China
China
-
 Colombia
-
 Congo
Congo
-
 Costa Rica
-
 Cote d'Ivoire
-
 Croatia
-
 Cuba
Cuba
-
 Cyprus
-
 Czechia
-
 DR Congo
-
 Denmark
-
 Dominican Republic
-
 Ecuador
-
 Egypt
Egypt
-
 El Salvador
-
 Estonia
-
 Eswatini
-
 Ethiopia
-
 Finland
-
 France
-
 Georgia
-
 Germany
-
 Ghana
Ghana
-
 Greece
-
 Haiti
Haiti
-
 Hong Kong
-
 Hungary
-
 India
India
-
 Indonesia
-
 Iran, Islamic republic
-
 Iraq
Iraq
-
 Ireland
-
 Israel
-
 Italy
Italy
-
 Jamaica
-
 Japan
Japan
-
 Jordan
-
 Kazakhstan
-
 Kenya
Kenya
-
 Korea
Korea
-
 Kuwait
-
 Kyrgyzstan
-
 Laos
Laos
-
 Latvia
-
 Lebanon
-
 Lesotho
-
 Libya
Libya
-
 Lithuania
-
 Luxembourg
-
 Madagascar
-
 Malaysia
-
 Malta
Malta
-
 Mauritius
-
 Mexico
-
 Moldova
-
 Mongolia
-
 Montenegro
-
 Morocco
-
 Mozambique
-
 Myanmar
-
 Namibia
-
 Nepal
Nepal
-
 Netherlands
-
 New Zealand
-
 Nigeria
-
 North Macedonia
-
 Norway
-
 Oman
Oman
-
 Pakistan
-
 Palestine
-
 Panama
-
 Papua New Guinea
-
 Paraguay
-
 Peru
Peru
-
 Philippines
-
 Poland
-
 Portugal
-
 Puerto Rico
-
 Qatar
Qatar
-
 Reunion
-
 Romania
-
 Rwanda
-
 Saudi Arabia
-
 Serbia
-
 Singapore
-
 Slovakia
-
 Slovenia
-
 Somalia
-
 South Africa
-
 Spain
Spain
-
 Sri Lanka
-
 Sweden
-
 Switzerland
-
 Syria
Syria
-
 Taiwan
-
 Tajikistan
-
 Tanzania
-
 Thailand
-
 Trinidad and Tobago
-
 Tunisia
-
 Turkey
-
 UAE
UAE
-
 Uganda
-
 Ukraine
-
 United Kingdom
-
United States
-
 Uruguay
-
 Uzbekistan
-
 Venezuela
-
 Vietnam
-
 Yemen
Yemen
-
 Zambia
-
 Zimbabwe
- Forex
- Crypto












