

Why is Tesla stock flat today? Full Self-Driving upgrade and $367.68 resistance levels in focus

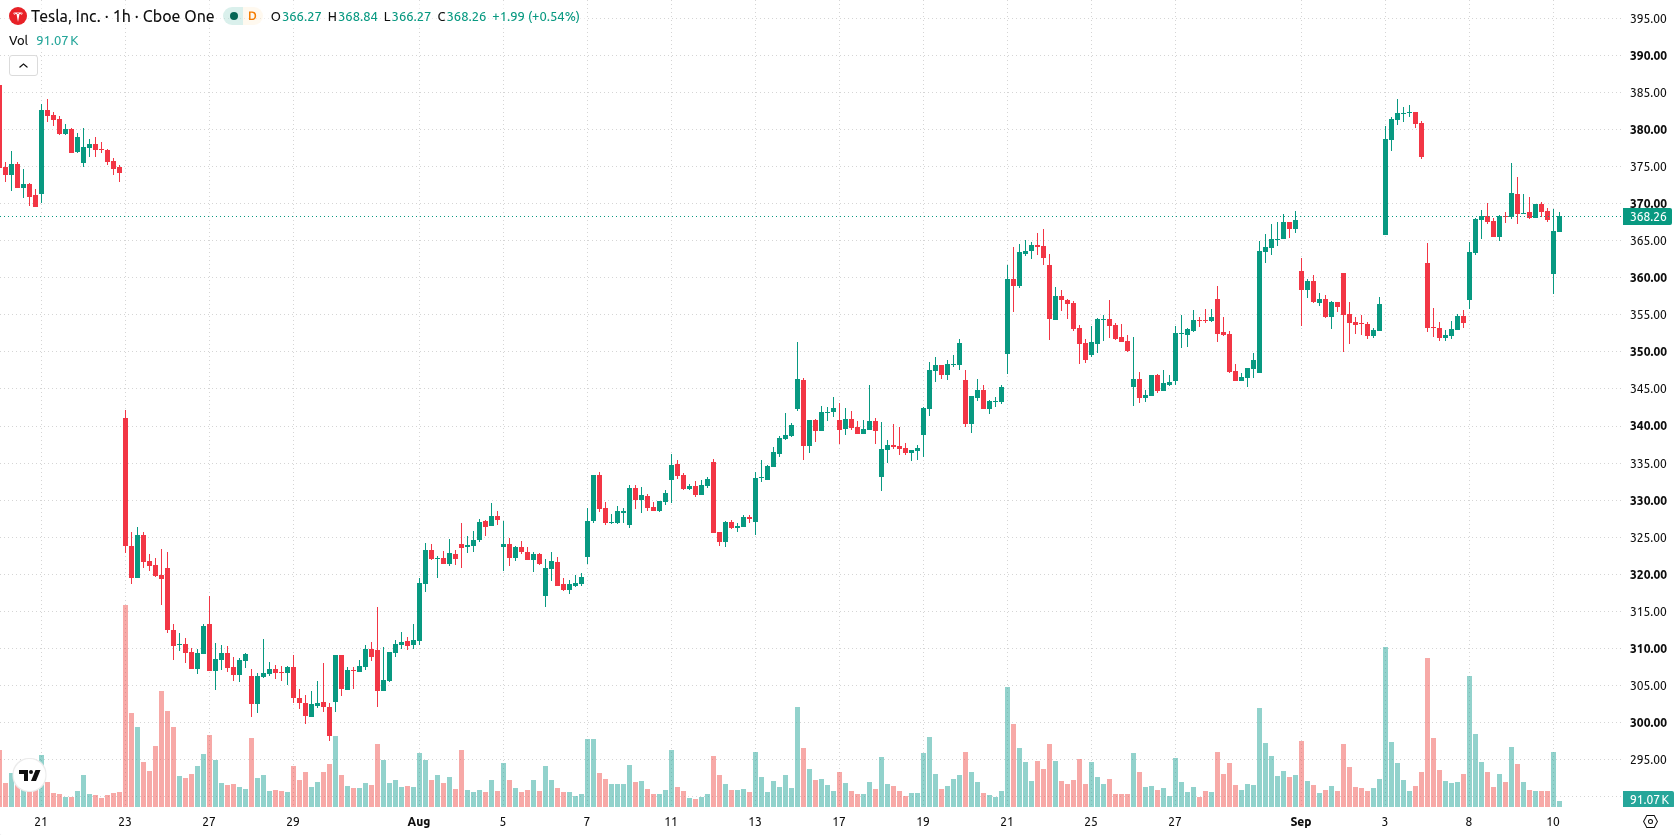
Tesla (TSLA) stock is trading at $366.8 after a slight move lower on the day. The price holds above its short- and medium-term moving averages but stays below the long-term average.
 403.82
408.36
Highlights
- Tesla CFO Vaibhav Taneja sold $938,419 of shares to cover taxes from vested restricted stock units, a routine executive transaction.
- Tesla released the 2026.32.3 software update with user interface and media improvements, and deployed upgraded Full Self-Driving features for various hardware versions.
- Shares of Tesla trade between $356.6 to $377 with near-term upward momentum favored but overbought readings suggest potential for sideways consolidation.
Executive share sale and software expansions as routine activity shapes focus
Tesla CFO Vaibhav Taneja sold $938,419 worth of company shares to address tax withholdings after the vesting of restricted stock units, a routine transaction disclosed by Investing.com that may draw some attention to executive activity but is usually interpreted as neutral in terms of ongoing company direction. Meanwhile, Tesla launched the 2026.32.3 software update with UI and media improvements, according to Notateslaapp, signaling iterative product enhancements for current owners. The company has also deployed new branches of its Full Self-Driving software, including advanced collision evasion features for HW4 hardware and a FSD v14 Lite upgrade for Model S and Model X vehicles with Hardware 3, as noted by Notateslaapp and Teslarati respectively, highlighting incremental advances in its self-driving platform.
Mixed momentum signals as MA-200 and resistance limit upside
On the technical front, TSLA is trading above both the MA-20 and MA-50, but remains below the MA-200. The Ichimoku Kijun at $367.68 serves as immediate resistance. MACD currently shows a buy signal while ADX is neutral, indicating only moderate trend strength. RSI stands at 53.84 and is in buy territory. Stochastic RSI is oversold, but CCI is neutral, resulting in mixed oscillator signals. Bull/Bear Power is overbought, reflecting buyer dominance intraday, while the Awesome Oscillator is neutral.
Consolidation favored as upside hinges on resistance breakout
In the short term, TSLA is expected to consolidate within a $356.6 to $377 range, reflecting typical volatility near current levels. There is a 63% chance of an upside move and a 37% likelihood of a downside scenario. The base case is a sideways consolidation within this corridor; a bullish breakout requires sustained movement above $367.68 resistance, while a confirmed move below $356.6 would expose further downside risks.
Earlier, analysts noted that Tesla was exhibiting near- to medium-term momentum while navigating heightened regulatory scrutiny and mixed technical signals. The latest technical configuration and incremental software enhancements reinforce the outlook for continued consolidation, making the $367.68 resistance level a pivotal area to monitor for a potential next move.











-
 Afghanistan
-
 Albania
-
 Algeria
-
 Angola
-
 Argentina
-
 Armenia
-
 Australia
-
 Austria
-
 Azerbaijan
-
 Bahamas
-
 Bahrain
-
 Bangladesh
-
 Belarus
-
 Belgium
-
 Bolivia
-
 Botswana
-
 Brazil
-
 Brunei
-
 Bulgaria
-
 Cambodia
-
 Cameroon
-
 Canada
-
 Chile
-
 China
-
 Colombia
-
 Congo
-
 Costa Rica
-
 Cote d'Ivoire
-
 Croatia
-
 Cuba
-
 Cyprus
-
 Czechia
-
 DR Congo
-
 Denmark
-
 Dominican Republic
-
 Ecuador
-
 Egypt
-
 El Salvador
-
 Estonia
-
 Eswatini
-
 Ethiopia
-
 Finland
-
 France
-
 Georgia
-
 Germany
-
 Ghana
-
 Greece
-
 Haiti
-
 Hong Kong
-
 Hungary
-
 India
-
 Indonesia
-
 Iran, Islamic republic
-
 Iraq
-
 Ireland
-
 Israel
-
 Italy
-
 Jamaica
-
 Japan
-
 Jordan
-
 Kazakhstan
-
 Kenya
-
 Korea
-
 Kuwait
-
 Kyrgyzstan
-
 Laos
-
 Latvia
-
 Lebanon
-
 Lesotho
-
 Libya
-
 Lithuania
-
 Luxembourg
-
 Madagascar
-
 Malaysia
-
 Malta
-
 Mauritius
-
 Mexico
-
 Moldova
-
 Mongolia
-
 Montenegro
-
 Morocco
-
 Mozambique
-
 Myanmar
-
 Namibia
-
 Nepal
-
 Netherlands
-
 New Zealand
-
 Nigeria
-
 North Macedonia
-
 Norway
-
 Oman
-
 Pakistan
-
 Palestine
-
 Panama
-
 Papua New Guinea
-
 Paraguay
-
 Peru
-
 Philippines
-
 Poland
-
 Portugal
-
 Puerto Rico
-
 Qatar
-
 Reunion
-
 Romania
-
 Rwanda
-
 Saudi Arabia
-
 Serbia
-
 Singapore
-
 Slovakia
-
 Slovenia
-
 Somalia
-
 South Africa
-
 Spain
-
 Sri Lanka
-
 Sweden
-
 Switzerland
-
 Syria
-
 Taiwan
-
 Tajikistan
-
 Tanzania
-
 Thailand
-
 Trinidad and Tobago
-
 Tunisia
-
 Turkey
-
 UAE
-
 Uganda
-
 Ukraine
-
 United Kingdom
-
United States
-
 Uruguay
-
 Uzbekistan
-
 Venezuela
-
 Vietnam
-
 Yemen
-
 Zambia
-
 Zimbabwe
- Forex
- Crypto












