

What's behind Summit Therapeutics' latest stock pullback?

Summit Therapeutics (SMMT) fell 3.14% amid strong overbought signals and intraday selling pressure in the absence of new corporate catalysts. The move is contradicted by the stock’s position above all major moving averages, which underscores underlying bullish momentum and highlights that the downside comes against broader technical strength.
 16.09
16.52
Highlights
- Shares of Summit Therapeutics maintain short- and medium-term bullish momentum above key moving averages despite an overall bearish long-term trend.
- Technical indicators are predominantly overbought, with both the RSI and Stochastic RSI indicating elevated risk of a near-term reversal.
- The stock is expected to trade between $16.24 and $17.74 over the next five sessions, with a 77% probability of upward movement.
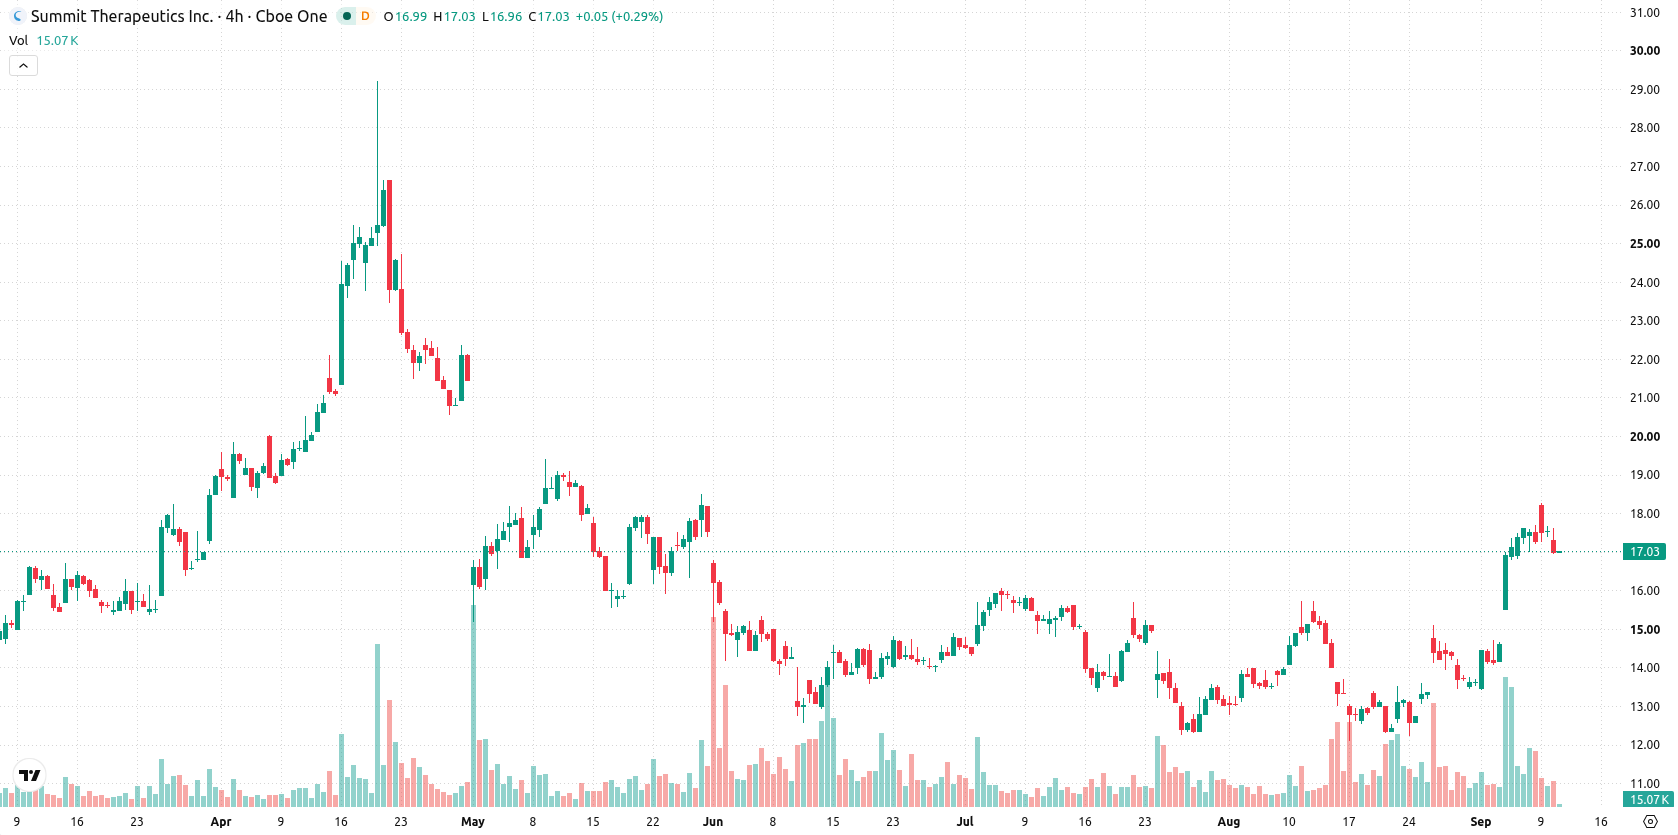
Mixed momentum signals as price nears resistance and remains overbought
Summit Therapeutics is trading above the 20-day, 50-day, and 200-day moving averages, with the current price at $16.99 compared to the MA-20 and MA-50 at $14.35 and the MA-200 at $16.42. This alignment signals short- and medium-term bullish momentum, with the nearest technical ceiling at $17.03 and the immediate floor at the week’s low of $16.82; the broader trend context remains bearish due to the MA-50 versus MA-200 relationship. Momentum indicators are mixed: the MACD points to further upside, the ADX is neutral, and both the RSI at 69.3 and Stochastic RSI at 94.69 indicate strongly overbought conditions, a view supported by the CCI at 173.35. The BBP at 2.85 confirms intraday buyer dominance, but also shows overbought status, and the AO supports ongoing positive trend signals. The price is down on the session with heightened intraday volatility at 3.46%, trading near the session's low, and technical readings suggest increased risk of a near-term reversal.
Earlier, analysts noted that Summit Therapeutics had shifted to a bullish technical setup following positive clinical developments and strong upward momentum. The current pullback highlights short-term overbought signals despite underlying technical strength, making the $17.03 resistance a critical level to monitor for confirming renewed upside or signaling a potential reversal.






Latest Summit Therapeutics News





-
 Afghanistan
-
 Albania
-
 Algeria
-
 Angola
-
 Argentina
-
 Armenia
-
 Australia
-
 Austria
-
 Azerbaijan
-
 Bahamas
-
 Bahrain
-
 Bangladesh
-
 Belarus
-
 Belgium
-
 Bolivia
-
 Botswana
-
 Brazil
-
 Brunei
-
 Bulgaria
-
 Cambodia
-
 Cameroon
-
 Canada
-
 Chile
-
 China
-
 Colombia
-
 Congo
-
 Costa Rica
-
 Cote d'Ivoire
-
 Croatia
-
 Cuba
-
 Cyprus
-
 Czechia
-
 DR Congo
-
 Denmark
-
 Dominican Republic
-
 Ecuador
-
 Egypt
-
 El Salvador
-
 Estonia
-
 Eswatini
-
 Ethiopia
-
 Finland
-
 France
-
 Georgia
-
 Germany
-
 Ghana
-
 Greece
-
 Haiti
-
 Hong Kong
-
 Hungary
-
 India
-
 Indonesia
-
 Iran, Islamic republic
-
 Iraq
-
 Ireland
-
 Israel
-
 Italy
-
 Jamaica
-
 Japan
-
 Jordan
-
 Kazakhstan
-
 Kenya
-
 Korea
-
 Kuwait
-
 Kyrgyzstan
-
 Laos
-
 Latvia
-
 Lebanon
-
 Lesotho
-
 Libya
-
 Lithuania
-
 Luxembourg
-
 Madagascar
-
 Malaysia
-
 Malta
-
 Mauritius
-
 Mexico
-
 Moldova
-
 Mongolia
-
 Montenegro
-
 Morocco
-
 Mozambique
-
 Myanmar
-
 Namibia
-
 Nepal
-
 Netherlands
-
 New Zealand
-
 Nigeria
-
 North Macedonia
-
 Norway
-
 Oman
-
 Pakistan
-
 Palestine
-
 Panama
-
 Papua New Guinea
-
 Paraguay
-
 Peru
-
 Philippines
-
 Poland
-
 Portugal
-
 Puerto Rico
-
 Qatar
-
 Reunion
-
 Romania
-
 Rwanda
-
 Saudi Arabia
-
 Serbia
-
 Singapore
-
 Slovakia
-
 Slovenia
-
 Somalia
-
 South Africa
-
 Spain
-
 Sri Lanka
-
 Sweden
-
 Switzerland
-
 Syria
-
 Taiwan
-
 Tajikistan
-
 Tanzania
-
 Thailand
-
 Trinidad and Tobago
-
 Tunisia
-
 Turkey
-
 UAE
-
 Uganda
-
 Ukraine
-
 United Kingdom
-
United States
-
 Uruguay
-
 Uzbekistan
-
 Venezuela
-
 Vietnam
-
 Yemen
-
 Zambia
-
 Zimbabwe
- Forex
- Crypto












