

Nvidia stock trades up amid short-term volatility shaking direction

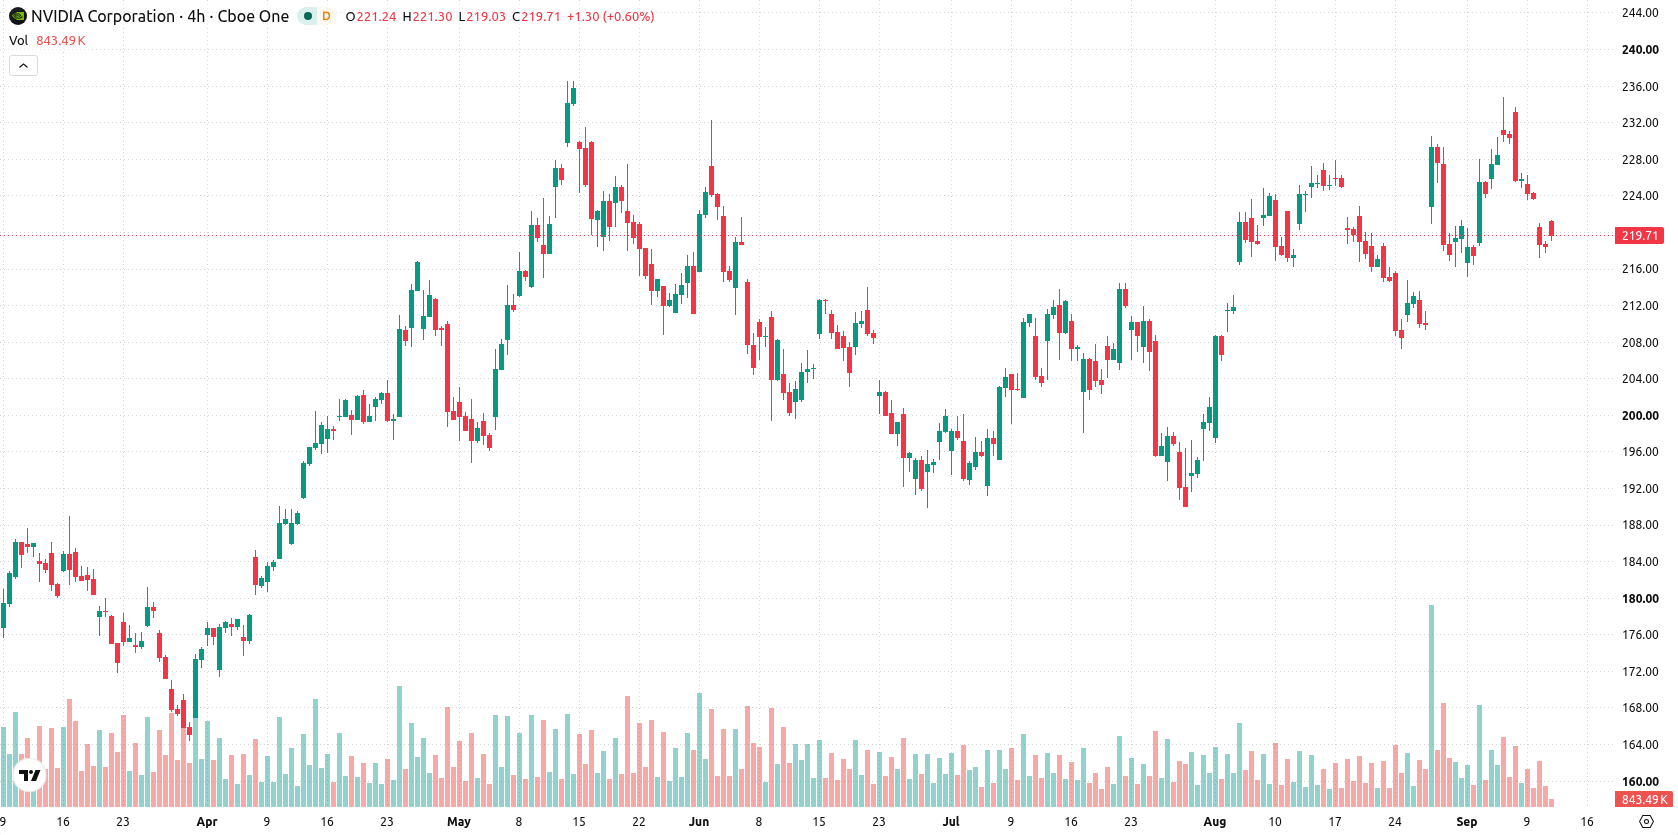
Nvidia (NVDA) stock is trading at $221.73, up 1.54% on the day. The price remains above its medium- and long-term moving averages but has slipped below its most recent short-term average, indicating near-term volatility.
 166.45
179.92
Highlights
- The U.S. Department of Justice has initiated a formal antitrust investigation into Nvidia's $20 billion licensing deal with Groq, raising regulatory uncertainty.
- The probe is focused on whether Nvidia structured the Groq transaction to bypass standard antitrust review, potentially affecting its AI strategy execution.
- Nvidia stock is up 1.54% at $221.73, with price action expected to trade between $214.87 and $228.58 over the next 2 to 3 days, as technical indicators present mixed momentum signals.
Regulatory uncertainty intensifies as DOJ probes major AI deal
Nvidia faces increased scrutiny as the U.S. Department of Justice has launched a formal antitrust investigation into its $20 billion licensing deal with AI chip developer Groq, according to Reuters. The inquiry centers on concerns that Nvidia may have structured the transaction to bypass standard antitrust review processes, raising the potential for legal challenges that could impact the company's ability to execute its AI strategy. While the probe introduces a degree of regulatory uncertainty, today's upward move in the stock suggests that the market may be weighing the immediate growth prospects and ongoing demand for AI technology against possible legal headwinds.
Momentum remains positive despite strong intraday selling pressure
On the technical front, NVDA is trading below the MA-20, while it continues to hold above the MA-50 and MA-200. The Ichimoku Kijun currently sits at $221.07, marking a key immediate support level. Among momentum indicators, MACD is rated Strong Buy and ADX is signaling Buy, reflecting underlying positive momentum. However, oscillator readings are more cautious: RSI and CCI are on Sell, Stoch RSI is in Oversold territory, and Bull/Bear Power also suggests an oversold condition, highlighting strong intraday seller dominance despite an unconfirmed rebound in price.
Balanced breakout risks as price consolidates within tight range
Looking ahead to the next 2–3 trading days, NVDA is expected to move within a typical volatility band between $214.87 and $228.58. Probabilities for both an upside breakout or downside move are evenly balanced at 50%. The baseline scenario sees price action consolidating sideways between immediate support and resistance. An upside breakout above the upper boundary would indicate renewed buying momentum, while a close below immediate support could open further downside risk.
Earlier, analysts noted that Nvidia’s price was consolidating within a neutral pattern as regulatory challenges coincided with potential avenues for expansion in artificial intelligence. The current analysis reinforces this backdrop of uncertainty, highlighting a balanced risk environment and suggesting that traders should pay close attention to moves outside the $214.87–$228.58 volatility band for early signs of directional momentum.






Latest NVIDIA News





-
 Afghanistan
-
 Albania
-
 Algeria
-
 Angola
-
 Argentina
-
 Armenia
-
 Australia
-
 Austria
-
 Azerbaijan
-
 Bahamas
-
 Bahrain
-
 Bangladesh
-
 Belarus
-
 Belgium
-
 Bolivia
-
 Botswana
-
 Brazil
-
 Brunei
-
 Bulgaria
-
 Cambodia
-
 Cameroon
-
 Canada
-
 Chile
-
 China
-
 Colombia
-
 Congo
-
 Costa Rica
-
 Cote d'Ivoire
-
 Croatia
-
 Cuba
-
 Cyprus
-
 Czechia
-
 DR Congo
-
 Denmark
-
 Dominican Republic
-
 Ecuador
-
 Egypt
-
 El Salvador
-
 Estonia
-
 Eswatini
-
 Ethiopia
-
 Finland
-
 France
-
 Georgia
-
 Germany
-
 Ghana
-
 Greece
-
 Haiti
-
 Hong Kong
-
 Hungary
-
 India
-
 Indonesia
-
 Iran, Islamic republic
-
 Iraq
-
 Ireland
-
 Israel
-
 Italy
-
 Jamaica
-
 Japan
-
 Jordan
-
 Kazakhstan
-
 Kenya
-
 Korea
-
 Kuwait
-
 Kyrgyzstan
-
 Laos
-
 Latvia
-
 Lebanon
-
 Lesotho
-
 Libya
-
 Lithuania
-
 Luxembourg
-
 Madagascar
-
 Malaysia
-
 Malta
-
 Mauritius
-
 Mexico
-
 Moldova
-
 Mongolia
-
 Montenegro
-
 Morocco
-
 Mozambique
-
 Myanmar
-
 Namibia
-
 Nepal
-
 Netherlands
-
 New Zealand
-
 Nigeria
-
 North Macedonia
-
 Norway
-
 Oman
-
 Pakistan
-
 Palestine
-
 Panama
-
 Papua New Guinea
-
 Paraguay
-
 Peru
-
 Philippines
-
 Poland
-
 Portugal
-
 Puerto Rico
-
 Qatar
-
 Reunion
-
 Romania
-
 Rwanda
-
 Saudi Arabia
-
 Serbia
-
 Singapore
-
 Slovakia
-
 Slovenia
-
 Somalia
-
 South Africa
-
 Spain
-
 Sri Lanka
-
 Sweden
-
 Switzerland
-
 Syria
-
 Taiwan
-
 Tajikistan
-
 Tanzania
-
 Thailand
-
 Trinidad and Tobago
-
 Tunisia
-
 Turkey
-
 UAE
-
 Uganda
-
 Ukraine
-
 United Kingdom
-
United States
-
 Uruguay
-
 Uzbekistan
-
 Venezuela
-
 Vietnam
-
 Yemen
-
 Zambia
-
 Zimbabwe
- Forex
- Crypto












