


HP Inc. (HPQ) surged 9.38% today on strong technical momentum, with buyers asserting control across all major indicators. The move is supported by a confirmed bullish trend, as the price remains firmly above key moving averages and tests the upper end of the recent trading range.
 29.59
34.26
Highlights
- Shares of HP trade in a sustained bullish trend above all major moving averages, indicating strong short and long-term momentum.
- The technical price range for the next five days is expected between $32.94 and $36.92, with a low probability of a downward move.
- Momentum signals, including MACD and ADX, show strong buying, though CCI and BBP indicate overbought conditions that warrant attention.
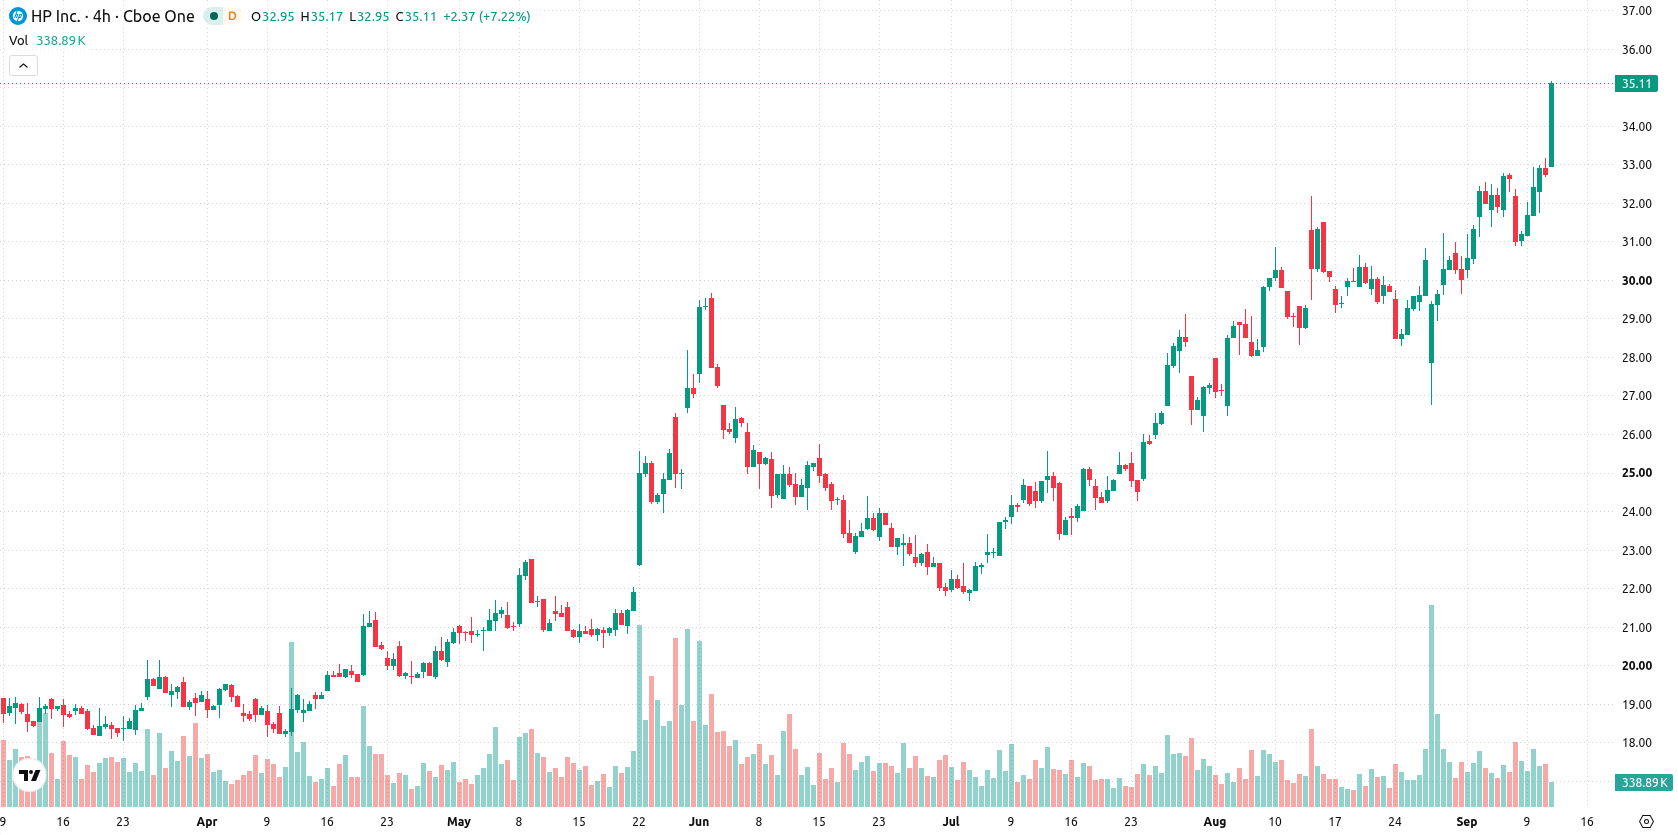
Overbought signals emerge as price tests resistance on strong buy momentum
HP is trading above all key moving averages, with the current price at $35.79 standing well above the MA-20 at $30.65, MA-50 at $27.79, and MA-200 at $23.01. This configuration signals a strong bullish trend across all timeframes, while the near-term ceiling sits at $36.92 and the support level is at $33.16. Momentum is underscored by strong MACD and ADX buy signals. The RSI is elevated at 63.18, not yet at extreme overbought territory, with CCI and BBP both indicating overbought conditions and underscoring aggressive buying activity. Stochastic RSI and Awesome Oscillator both read neutral, but price action remains close to the day's high, with robust intraday volatility of 4.41% highlighting upside dominance. Overbought signals suggest caution as momentum may be stretched.
Earlier, analysts noted HP’s strong technical performance and recent 52-week high, highlighting its leadership among sector peers. The current surge further strengthens this trend, with $36.92 emerging as an immediate breakout level for traders to monitor.










-
 Afghanistan
-
 Albania
-
 Algeria
-
 Angola
-
 Argentina
-
 Armenia
-
 Australia
-
 Austria
-
 Azerbaijan
-
 Bahamas
-
 Bahrain
-
 Bangladesh
-
 Belarus
-
 Belgium
-
 Bolivia
-
 Botswana
-
 Brazil
-
 Brunei
-
 Bulgaria
-
 Cambodia
-
 Cameroon
-
 Canada
-
 Chile
-
 China
-
 Colombia
-
 Congo
-
 Costa Rica
-
 Cote d'Ivoire
-
 Croatia
-
 Cuba
-
 Cyprus
-
 Czechia
-
 DR Congo
-
 Denmark
-
 Dominican Republic
-
 Ecuador
-
 Egypt
-
 El Salvador
-
 Estonia
-
 Eswatini
-
 Ethiopia
-
 Finland
-
 France
-
 Georgia
-
 Germany
-
 Ghana
-
 Greece
-
 Haiti
-
 Hong Kong
-
 Hungary
-
 India
-
 Indonesia
-
 Iran, Islamic republic
-
 Iraq
-
 Ireland
-
 Israel
-
 Italy
-
 Jamaica
-
 Japan
-
 Jordan
-
 Kazakhstan
-
 Kenya
-
 Korea
-
 Kuwait
-
 Kyrgyzstan
-
 Laos
-
 Latvia
-
 Lebanon
-
 Lesotho
-
 Libya
-
 Lithuania
-
 Luxembourg
-
 Madagascar
-
 Malaysia
-
 Malta
-
 Mauritius
-
 Mexico
-
 Moldova
-
 Mongolia
-
 Montenegro
-
 Morocco
-
 Mozambique
-
 Myanmar
-
 Namibia
-
 Nepal
-
 Netherlands
-
 New Zealand
-
 Nigeria
-
 North Macedonia
-
 Norway
-
 Oman
-
 Pakistan
-
 Palestine
-
 Panama
-
 Papua New Guinea
-
 Paraguay
-
 Peru
-
 Philippines
-
 Poland
-
 Portugal
-
 Puerto Rico
-
 Qatar
-
 Reunion
-
 Romania
-
 Rwanda
-
 Saudi Arabia
-
 Serbia
-
 Singapore
-
 Slovakia
-
 Slovenia
-
 Somalia
-
 South Africa
-
 Spain
-
 Sri Lanka
-
 Sweden
-
 Switzerland
-
 Syria
-
 Taiwan
-
 Tajikistan
-
 Tanzania
-
 Thailand
-
 Trinidad and Tobago
-
 Tunisia
-
 Turkey
-
 UAE
-
 Uganda
-
 Ukraine
-
 United Kingdom
-
United States
-
 Uruguay
-
 Uzbekistan
-
 Venezuela
-
 Vietnam
-
 Yemen
-
 Zambia
-
 Zimbabwe
- Forex
- Crypto












