


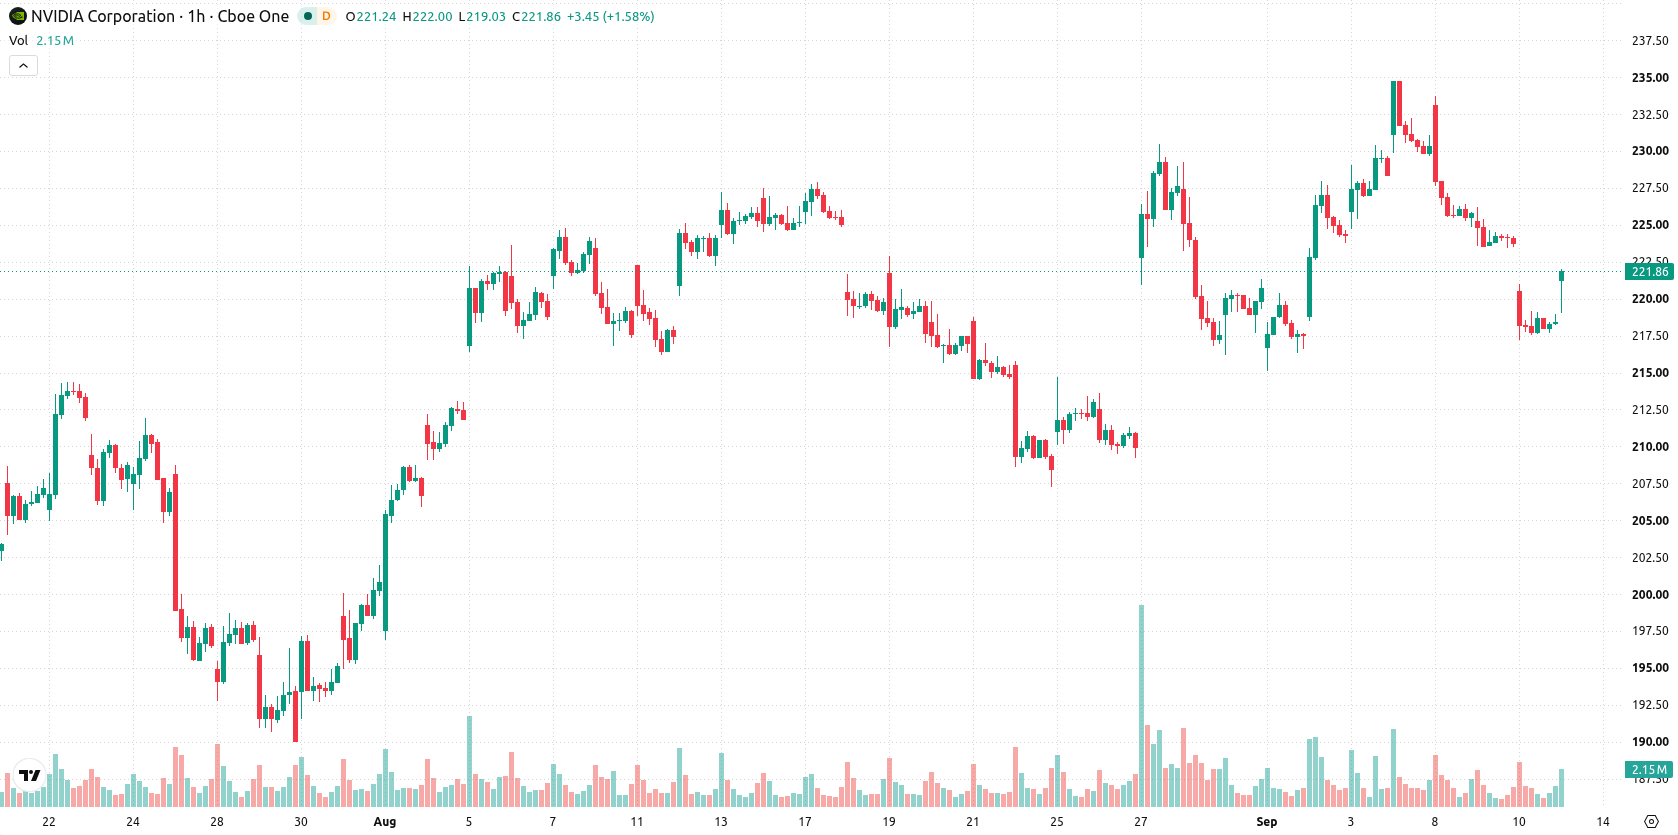
Nvidia (NVDA) stock is trading at $221.84 after gaining 1.59% today, moving higher on the session. The price currently sits below its key short- and medium-term moving averages but remains above its long-term levels.
 166.45
179.92
Highlights
- Nvidia faces a Department of Justice antitrust investigation into its $20 billion licensing agreement with AI chip startup Groq.
- Nvidia exceeded its annual shareholder return target by distributing 60% of free cash flow in fiscal year 2027 and confirmed a $0.25 per share dividend for October 1, 2026.
- Nvidia stock is consolidating within a $215.71 to $227.97 range as short-term technicals indicate seller dominance and moderate intraday volatility.
Regulatory spotlight intensifies amid global AI expansion and capital returns
Nvidia is facing heightened attention from regulators after the U.S. Department of Justice launched an antitrust investigation into its $20 billion licensing deal with AI chip startup Groq, a development reported by The New York Times. While this introduces a layer of uncertainty around Nvidia's expansion in the AI sector, the company continues to actively return capital to shareholders, exceeding its annual target by distributing 60% of free cash flow so far in fiscal year 2027, according to Fool, and confirming a $0.25 per share cash dividend payable on October 1, 2026. Additionally, Nvidia recently initiated a partnership with eight Australian cloud and data center operators to deliver up to 2 gigawatts of AI compute capacity, reinforcing its position in international AI infrastructure markets.
Technical bias turns bearish as sell momentum meets oversold signals
NVDA is trading below its MA-20 at $222.59 and MA-50 at $224.37 on the hourly chart, with the MA-200 at $197.26 on the daily timeframe continuing to serve as major support. Immediate resistance is established at the Ichimoku Kijun of $225.46, while key support is found near $215.71. Momentum indicators paint a cautious technical picture: MACD, ADX, and CCI all signal Sell, and RSI remains weak at 31.26, also suggesting a bearish bias. Meanwhile, Stochastic RSI is Neutral, and Bull/Bear Power flags oversold conditions as sellers dominate the intraday tone, while Awesome Oscillator is Neutral and does not reinforce a directional trend.
Range-bound trade likely as breakout risks remain balanced
Over the short term, NVDA is likely to trade within a range of $215.71 to $227.97, consistent with typical volatility for recent sessions. The probability of an upward move stands at 52%, with downside risk at 48%, highlighting a nearly balanced outlook. The baseline scenario sees price consolidating within this corridor; a break above $225.46 would open a bullish scenario, while a move below support at $215.71 could trigger renewed seller interest.
Earlier, analysts noted that Nvidia's stock was consolidating within a neutral pattern amid regulatory challenges and potential AI-driven growth opportunities. The current analysis reinforces this balanced risk environment and introduces the added dynamic of aggressive capital returns, suggesting traders should closely monitor price action near the $225.46 resistance and $215.71 support for early signs of a directional breakout.











-
 Afghanistan
-
 Albania
-
 Algeria
-
 Angola
-
 Argentina
-
 Armenia
-
 Australia
-
 Austria
-
 Azerbaijan
-
 Bahamas
-
 Bahrain
-
 Bangladesh
-
 Belarus
-
 Belgium
-
 Bolivia
-
 Botswana
-
 Brazil
-
 Brunei
-
 Bulgaria
-
 Cambodia
-
 Cameroon
-
 Canada
-
 Chile
-
 China
-
 Colombia
-
 Congo
-
 Costa Rica
-
 Cote d'Ivoire
-
 Croatia
-
 Cuba
-
 Cyprus
-
 Czechia
-
 DR Congo
-
 Denmark
-
 Dominican Republic
-
 Ecuador
-
 Egypt
-
 El Salvador
-
 Estonia
-
 Eswatini
-
 Ethiopia
-
 Finland
-
 France
-
 Georgia
-
 Germany
-
 Ghana
-
 Greece
-
 Haiti
-
 Hong Kong
-
 Hungary
-
 India
-
 Indonesia
-
 Iran, Islamic republic
-
 Iraq
-
 Ireland
-
 Israel
-
 Italy
-
 Jamaica
-
 Japan
-
 Jordan
-
 Kazakhstan
-
 Kenya
-
 Korea
-
 Kuwait
-
 Kyrgyzstan
-
 Laos
-
 Latvia
-
 Lebanon
-
 Lesotho
-
 Libya
-
 Lithuania
-
 Luxembourg
-
 Madagascar
-
 Malaysia
-
 Malta
-
 Mauritius
-
 Mexico
-
 Moldova
-
 Mongolia
-
 Montenegro
-
 Morocco
-
 Mozambique
-
 Myanmar
-
 Namibia
-
 Nepal
-
 Netherlands
-
 New Zealand
-
 Nigeria
-
 North Macedonia
-
 Norway
-
 Oman
-
 Pakistan
-
 Palestine
-
 Panama
-
 Papua New Guinea
-
 Paraguay
-
 Peru
-
 Philippines
-
 Poland
-
 Portugal
-
 Puerto Rico
-
 Qatar
-
 Reunion
-
 Romania
-
 Rwanda
-
 Saudi Arabia
-
 Serbia
-
 Singapore
-
 Slovakia
-
 Slovenia
-
 Somalia
-
 South Africa
-
 Spain
-
 Sri Lanka
-
 Sweden
-
 Switzerland
-
 Syria
-
 Taiwan
-
 Tajikistan
-
 Tanzania
-
 Thailand
-
 Trinidad and Tobago
-
 Tunisia
-
 Turkey
-
 UAE
-
 Uganda
-
 Ukraine
-
 United Kingdom
-
United States
-
 Uruguay
-
 Uzbekistan
-
 Venezuela
-
 Vietnam
-
 Yemen
-
 Zambia
-
 Zimbabwe
- Forex
- Crypto












