


A strong technical uptrend and bullish momentum have triggered a 7.32% rally in CDW Corporation (CDW) today. The move is supported by the price surging above its major moving averages, with the setup favoring further upside as buyers drive the stock toward recent highs.
 152.29
152.29
152.29
Highlights
- Shares of CDW trade in a bullish structure above key moving averages across all major timeframes.
- Momentum and oscillator signals are mixed, with MACD reading strong buy but RSI indicating sell and short-term trend neutral.
- CDW stock projects a five-day range of $140.78 to $158.55, with 59% probability assigned to an upward move.
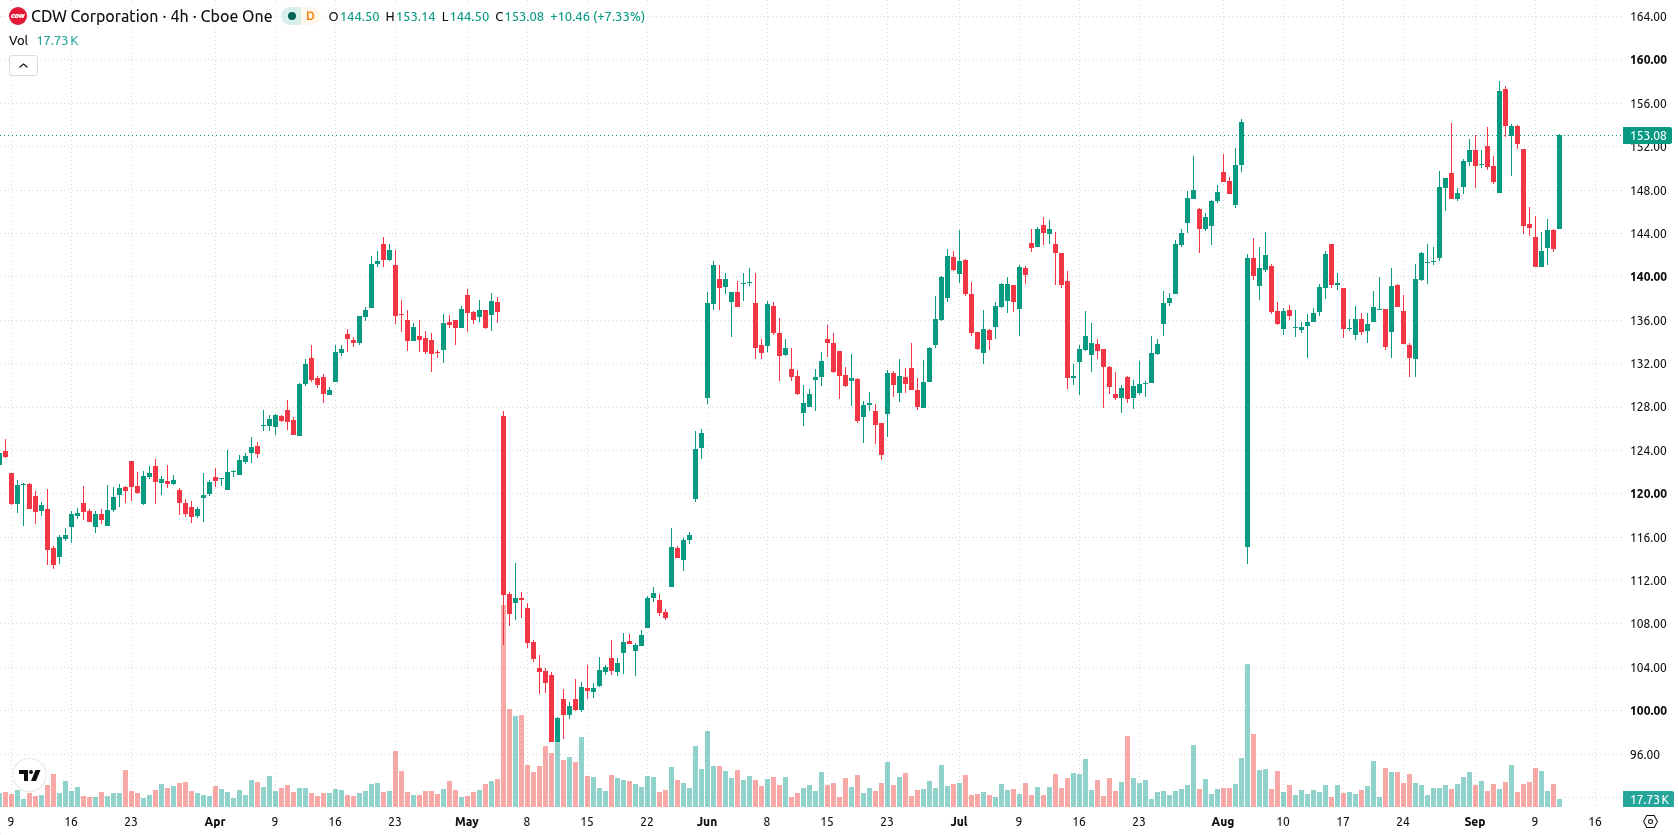
Mixed momentum emerges as bullish structure faces indicator divergence
CDW is trading above its 20-day, 50-day, and 200-day moving averages at $142.94, $140.27, and $131.83, respectively, highlighting a bullish structure across short-, medium-, and long-term horizons. The next near-term ceiling is at $158.55, with immediate support at $152. Longer-term trend confirmation is provided by the wide gap to the 50- and 200-day moving averages as well as the Ichimoku Kijun at $135.52. Momentum indicators present a mixed picture, with the MACD signaling 'Strong Buy', the ADX remaining neutral, RSI at 49.41 with a 'Sell' call, and the Stochastic RSI at 26.42 with a neutral reading. Bull/Bear Power is marginally positive at 0.01 and reads 'Oversold', pointing to buyers narrowly leading intraday. Intraday volatility is 2.49%, and the session tone is strong toward the highs, but divergence across oscillators and momentum signals warrants some caution.
Earlier, analysts noted that CDW was exhibiting a sustained bullish technical structure, though some indicators suggested caution regarding the pace of further gains. The latest move strengthens this outlook, with technical signals supporting a continued uptrend and traders advised to monitor the $158.55 resistance as a key pivot for potential breakout risk.





Latest CDW Corporation News




-
 Afghanistan
-
 Albania
-
 Algeria
-
 Angola
-
 Argentina
-
 Armenia
-
 Australia
-
 Austria
-
 Azerbaijan
-
 Bahamas
-
 Bahrain
-
 Bangladesh
-
 Belarus
-
 Belgium
-
 Bolivia
-
 Botswana
-
 Brazil
-
 Brunei
-
 Bulgaria
-
 Cambodia
-
 Cameroon
-
 Canada
-
 Chile
Chile
-
 China
China
-
 Colombia
-
 Congo
Congo
-
 Costa Rica
-
 Cote d'Ivoire
-
 Croatia
-
 Cuba
Cuba
-
 Cyprus
-
 Czechia
-
 DR Congo
-
 Denmark
-
 Dominican Republic
-
 Ecuador
-
 Egypt
Egypt
-
 El Salvador
-
 Estonia
-
 Eswatini
-
 Ethiopia
-
 Finland
-
 France
-
 Georgia
-
 Germany
-
 Ghana
Ghana
-
 Greece
-
 Haiti
Haiti
-
 Hong Kong
-
 Hungary
-
 India
India
-
 Indonesia
-
 Iran, Islamic republic
-
 Iraq
Iraq
-
 Ireland
-
 Israel
-
 Italy
Italy
-
 Jamaica
-
 Japan
Japan
-
 Jordan
-
 Kazakhstan
-
 Kenya
Kenya
-
 Korea
Korea
-
 Kuwait
-
 Kyrgyzstan
-
 Laos
Laos
-
 Latvia
-
 Lebanon
-
 Lesotho
-
 Libya
Libya
-
 Lithuania
-
 Luxembourg
-
 Madagascar
-
 Malaysia
-
 Malta
Malta
-
 Mauritius
-
 Mexico
-
 Moldova
-
 Mongolia
-
 Montenegro
-
 Morocco
-
 Mozambique
-
 Myanmar
-
 Namibia
-
 Nepal
Nepal
-
 Netherlands
-
 New Zealand
-
 Nigeria
-
 North Macedonia
-
 Norway
-
 Oman
Oman
-
 Pakistan
-
 Palestine
-
 Panama
-
 Papua New Guinea
-
 Paraguay
-
 Peru
Peru
-
 Philippines
-
 Poland
-
 Portugal
-
 Puerto Rico
-
 Qatar
Qatar
-
 Reunion
-
 Romania
-
 Rwanda
-
 Saudi Arabia
-
 Serbia
-
 Singapore
-
 Slovakia
-
 Slovenia
-
 Somalia
-
 South Africa
-
 Spain
Spain
-
 Sri Lanka
-
 Sweden
-
 Switzerland
-
 Syria
Syria
-
 Taiwan
-
 Tajikistan
-
 Tanzania
-
 Thailand
-
 Trinidad and Tobago
-
 Tunisia
-
 Turkey
-
 UAE
UAE
-
 Uganda
-
 Ukraine
-
 United Kingdom
-
United States
-
 Uruguay
-
 Uzbekistan
-
 Venezuela
-
 Vietnam
-
 Yemen
Yemen
-
 Zambia
-
 Zimbabwe
- Forex
- Crypto












