

Affirm stock outlook: Intraday rally outpaces underlying selling pressure

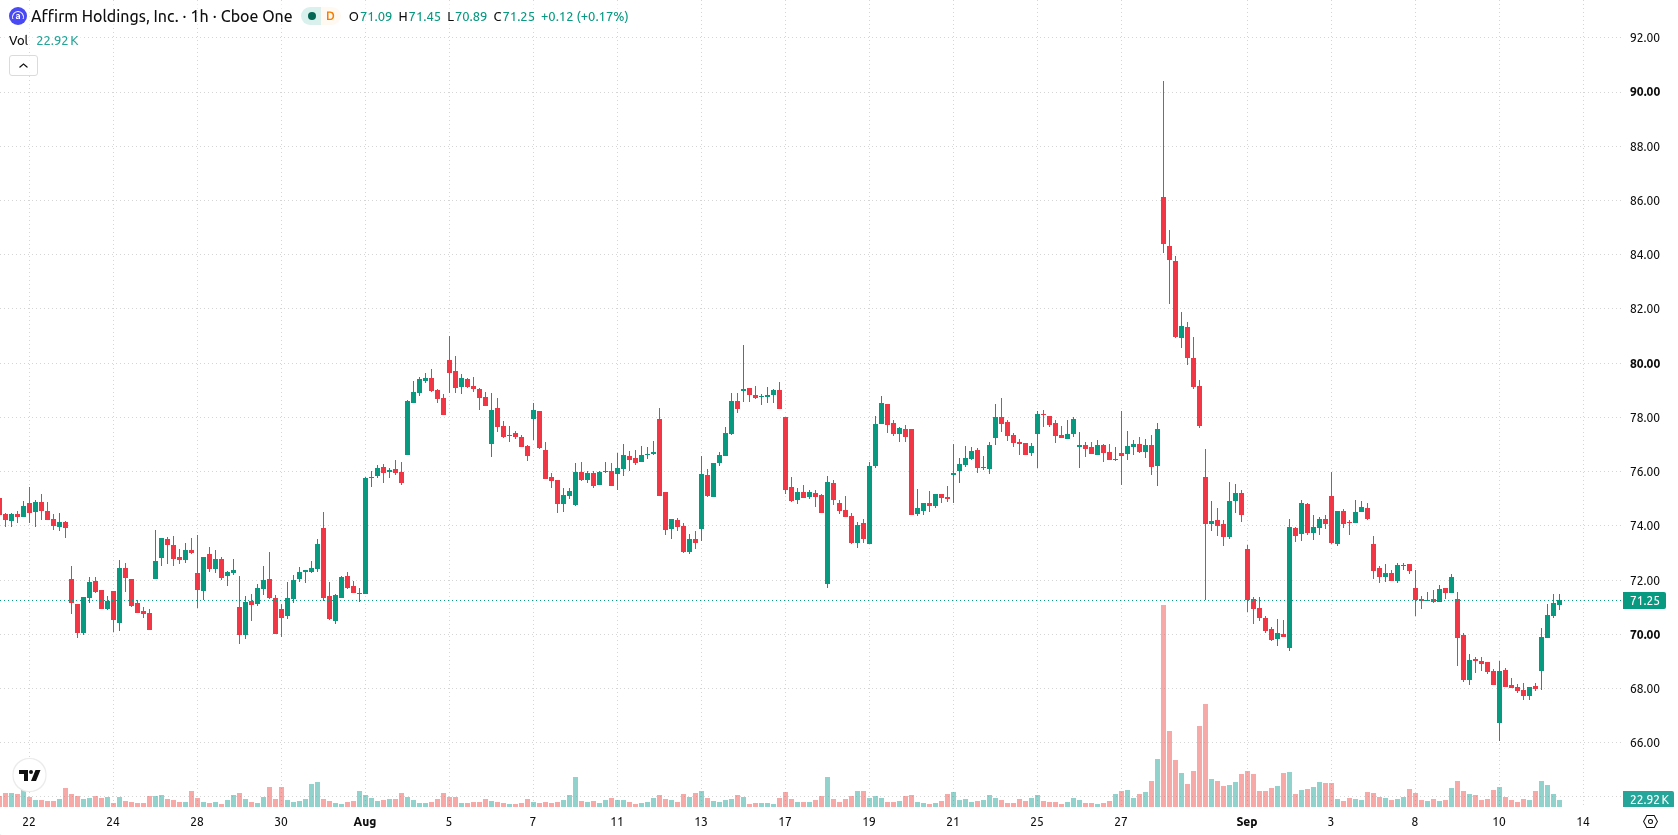
Affirm Holdings, Inc. (AFRM) stock is trading at $71.31, up 4.88% today and holding close to the session high on elevated volatility. The price remains above its key moving averages, suggesting short-term momentum is robust.
 64.10
69.10
Highlights
- AFRM/USD trades above key short-, medium-, and long-term moving averages, confirming a bullish price structure across timeframes.
- Momentum indicators show mixed signals with strong selling indicated by MACD and ADX, but buyer strength evident intraday and in oscillators.
- The projected 2 to 3 day range is $68.56 to $74.06, with a higher probability the price trends lower within this range unless support at $69.32 breaks or resistance is surpassed.
Buy signals and overbought readings clash with bearish momentum
MA-20 is set at $69.24, MA-50 at $71.29, and MA-200 at $66.59. The Ichimoku Kijun sits at $69.32, currently serving as support. Momentum readings are mixed: MACD points to strong selling, while ADX also highlights seller strength. However, RSI at 56.29 and CCI both indicate buying signals, and Stochastic RSI registers as overbought. Bull/Bear Power favors buyers intraday, and price action remains close to the day's high. This divergence among indicators underlines conflicting momentum and oscillators, with intraday strength contrasting the bearish signal from MACD and ADX.
Downside risk dominates as rangebound trade persists
For the next two to three days, AFRM's price is likely to stay within the $68.56 to $74.06 range. The probability of an upward breakout is 43%, making a downward scenario more likely in the short term. The baseline scenario anticipates consolidation within this volatility band, while a move above $74.06 would indicate bullish momentum resuming, and a drop below $69.32 would signal a bearish shift.
Earlier, analysts noted that Affirm was under persistent technical pressure despite solid business performance, emphasizing the need to watch for directional signals. The current price action, marked by robust intraday momentum and mixed indicator signals, suggests traders should monitor $74.06 on the upside and $69.32 on the downside to gauge the next decisive move.










-
 Afghanistan
-
 Albania
-
 Algeria
-
 Angola
-
 Argentina
-
 Armenia
-
 Australia
-
 Austria
-
 Azerbaijan
-
 Bahamas
-
 Bahrain
-
 Bangladesh
-
 Belarus
-
 Belgium
-
 Bolivia
-
 Botswana
-
 Brazil
-
 Brunei
-
 Bulgaria
-
 Cambodia
-
 Cameroon
-
 Canada
-
 Chile
-
 China
-
 Colombia
-
 Congo
-
 Costa Rica
-
 Cote d'Ivoire
-
 Croatia
-
 Cuba
-
 Cyprus
-
 Czechia
-
 DR Congo
-
 Denmark
-
 Dominican Republic
-
 Ecuador
-
 Egypt
-
 El Salvador
-
 Estonia
-
 Eswatini
-
 Ethiopia
-
 Finland
-
 France
-
 Georgia
-
 Germany
-
 Ghana
-
 Greece
-
 Haiti
-
 Hong Kong
-
 Hungary
-
 India
-
 Indonesia
-
 Iran, Islamic republic
-
 Iraq
-
 Ireland
-
 Israel
-
 Italy
-
 Jamaica
-
 Japan
-
 Jordan
-
 Kazakhstan
-
 Kenya
-
 Korea
-
 Kuwait
-
 Kyrgyzstan
-
 Laos
-
 Latvia
-
 Lebanon
-
 Lesotho
-
 Libya
-
 Lithuania
-
 Luxembourg
-
 Madagascar
-
 Malaysia
-
 Malta
-
 Mauritius
-
 Mexico
-
 Moldova
-
 Mongolia
-
 Montenegro
-
 Morocco
-
 Mozambique
-
 Myanmar
-
 Namibia
-
 Nepal
-
 Netherlands
-
 New Zealand
-
 Nigeria
-
 North Macedonia
-
 Norway
-
 Oman
-
 Pakistan
-
 Palestine
-
 Panama
-
 Papua New Guinea
-
 Paraguay
-
 Peru
-
 Philippines
-
 Poland
-
 Portugal
-
 Puerto Rico
-
 Qatar
-
 Reunion
-
 Romania
-
 Rwanda
-
 Saudi Arabia
-
 Serbia
-
 Singapore
-
 Slovakia
-
 Slovenia
-
 Somalia
-
 South Africa
-
 Spain
-
 Sri Lanka
-
 Sweden
-
 Switzerland
-
 Syria
-
 Taiwan
-
 Tajikistan
-
 Tanzania
-
 Thailand
-
 Trinidad and Tobago
-
 Tunisia
-
 Turkey
-
 UAE
-
 Uganda
-
 Ukraine
-
 United Kingdom
-
United States
-
 Uruguay
-
 Uzbekistan
-
 Venezuela
-
 Vietnam
-
 Yemen
-
 Zambia
-
 Zimbabwe
- Forex
- Crypto












