

Fair Isaac shares gain almost 4% after oversold bounce despite bearish momentum

Fair Isaac Corporation (FICO) surged 3.75% amid a sharp intraday gain, driven by an oversold bounce as sellers briefly stepped aside. The rebound looks limited, with the stock still trading below all key moving averages, which highlights persistent downward pressure across timeframes.
 704.78
761.34
Highlights
- Fair Isaac stock trades below all key moving averages, indicating persistent selling pressure across time frames.
- Momentum indicators and oscillators remain bearish, with the stock showing oversold conditions and a prevailing downside trend.
- Over the next five trading days, Fair Isaac is expected to consolidate between $950.64 and $1,042 with upward moves unlikely.
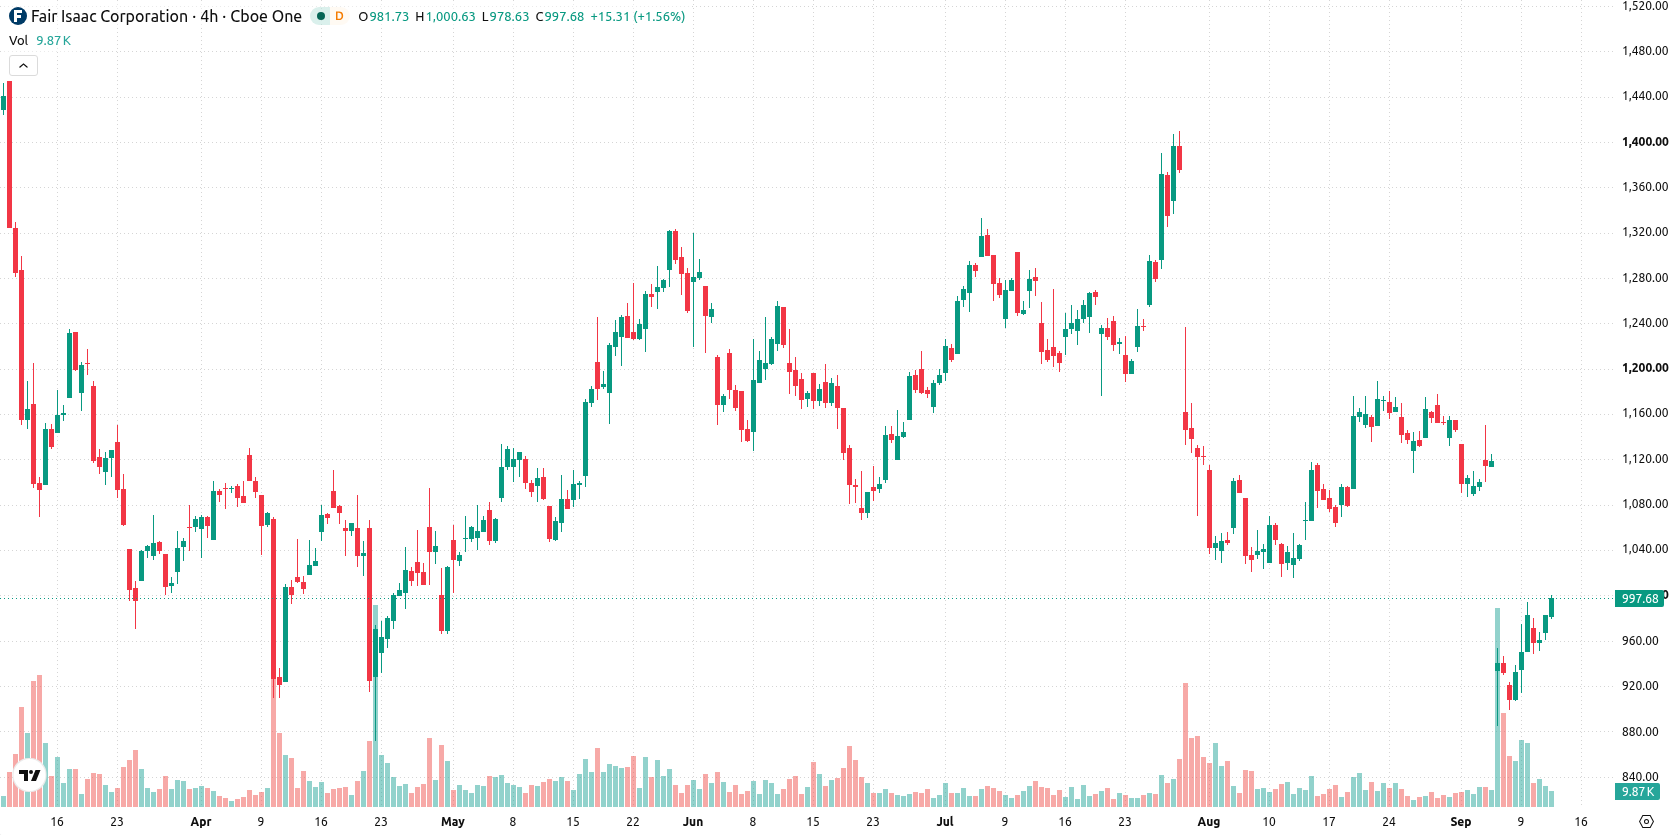
Sustained bearish momentum as price stays under all moving averages
Fair Isaac is trading below all key moving averages, including the MA-20 at $1,092, MA-50 at $1,153, and MA-200 at $1,293, highlighting ongoing pressure from sellers in the short, medium, and long term. The nearest resistance for the stock stands at $1,036 (Ichimoku Kijun), with support found at $991.74. Momentum signals remain bearish, as both the Moving Average Convergence Divergence (MACD) and Relative Strength Index (RSI) indicate a sell stance and downward direction. The Commodity Channel Index (CCI) and Bull/Bear Power (BBP) signal oversold conditions, and sellers firmly dominate intraday momentum, as BBP is negative. The Awesome Oscillator confirms the prevailing downside trend. Despite the sharp gain to $996.59, the price remains near the day's high, with intraday volatility at 2.97%. Most momentum indicators do not yet confirm durable bullishness.
Earlier, analysts noted that Fair Isaac was experiencing persistent bearish momentum, underpinned by sustained selling pressure across all major timeframes. The current technical setup reinforces this outlook, with prevailing downside risk making the $991.74 support a critical level for traders to monitor in the days ahead.






Latest Fair Isaac Corporation News




-
 Afghanistan
-
 Albania
-
 Algeria
-
 Angola
-
 Argentina
-
 Armenia
-
 Australia
-
 Austria
-
 Azerbaijan
-
 Bahamas
-
 Bahrain
-
 Bangladesh
-
 Belarus
-
 Belgium
-
 Bolivia
-
 Botswana
-
 Brazil
-
 Brunei
-
 Bulgaria
-
 Cambodia
-
 Cameroon
-
 Canada
-
 Chile
-
 China
-
 Colombia
-
 Congo
-
 Costa Rica
-
 Cote d'Ivoire
-
 Croatia
-
 Cuba
-
 Cyprus
-
 Czechia
-
 DR Congo
-
 Denmark
-
 Dominican Republic
-
 Ecuador
-
 Egypt
-
 El Salvador
-
 Estonia
-
 Eswatini
-
 Ethiopia
-
 Finland
-
 France
-
 Georgia
-
 Germany
-
 Ghana
-
 Greece
-
 Haiti
-
 Hong Kong
-
 Hungary
-
 India
-
 Indonesia
-
 Iran, Islamic republic
-
 Iraq
-
 Ireland
-
 Israel
-
 Italy
-
 Jamaica
-
 Japan
-
 Jordan
-
 Kazakhstan
-
 Kenya
-
 Korea
-
 Kuwait
-
 Kyrgyzstan
-
 Laos
-
 Latvia
-
 Lebanon
-
 Lesotho
-
 Libya
-
 Lithuania
-
 Luxembourg
-
 Madagascar
-
 Malaysia
-
 Malta
-
 Mauritius
-
 Mexico
-
 Moldova
-
 Mongolia
-
 Montenegro
-
 Morocco
-
 Mozambique
-
 Myanmar
-
 Namibia
-
 Nepal
-
 Netherlands
-
 New Zealand
-
 Nigeria
-
 North Macedonia
-
 Norway
-
 Oman
-
 Pakistan
-
 Palestine
-
 Panama
-
 Papua New Guinea
-
 Paraguay
-
 Peru
-
 Philippines
-
 Poland
-
 Portugal
-
 Puerto Rico
-
 Qatar
-
 Reunion
-
 Romania
-
 Rwanda
-
 Saudi Arabia
-
 Serbia
-
 Singapore
-
 Slovakia
-
 Slovenia
-
 Somalia
-
 South Africa
-
 Spain
-
 Sri Lanka
-
 Sweden
-
 Switzerland
-
 Syria
-
 Taiwan
-
 Tajikistan
-
 Tanzania
-
 Thailand
-
 Trinidad and Tobago
-
 Tunisia
-
 Turkey
-
 UAE
-
 Uganda
-
 Ukraine
-
 United Kingdom
-
United States
-
 Uruguay
-
 Uzbekistan
-
 Venezuela
-
 Vietnam
-
 Yemen
-
 Zambia
-
 Zimbabwe
- Forex
- Crypto












