

FICO slides around 16.5% as bearish indicators and downside gap drive turbulence

Fair Isaac Corporation (FICO) dropped 16.41% as strong technical selling pressure and a significant downside gap drove the move. The decline is supported by bearish momentum indicators and the stock's position well below all major moving averages.
 715.99
780.56
Highlights
- Fair Isaac stock trades well below key moving averages, indicating persistent bearish pressure across all time frames.
- Momentum indicators show strong selling signals, weak trend strength, and mild downside risk despite some intraday buyer activity.
- Expected five-day trading range is $709.17 to $970.57, with 76% probability of a downward move if support at $885 fails.
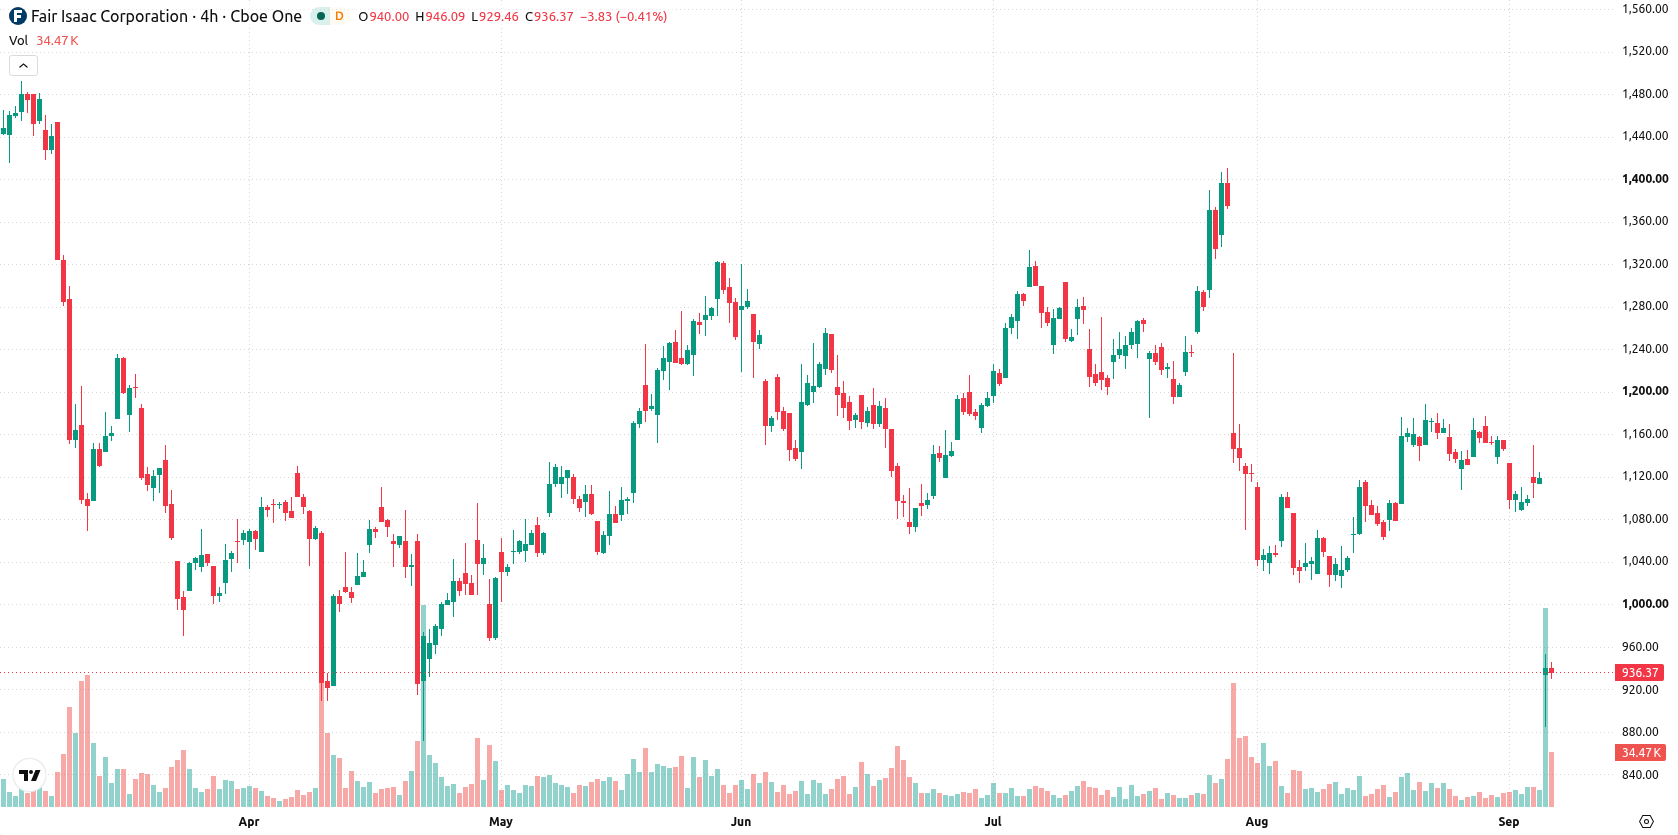
Bearish pressure across trends as mixed momentum signals persist
Fair Isaac is trading well below its 20-day, 50-day, and 200-day moving averages ($1,110, $1,171, and $1,308), indicating bearish pressure across short-, medium-, and long-term trends. The nearest support is at $885 and resistance is at $944.14. The 50-day versus 200-day alignment confirms the prevailing bearish structure. Momentum indicators are mostly negative. The MACD signals a strong sell, and the ADX is neutral with low trend strength. The RSI shows mild downside risk at 47.62, while the Stochastic RSI suggests a possible buy and the CCI remains neutral. Bull/Bear Power is positive at 24.7, indicating intraday buyers dominate, but its overbought outlook signals limited upside. The Awesome Oscillator confirms selling momentum. The stock opened with a pronounced downside gap near $184 or 16.49%, and currently trades near the top of today's range. Intraday volatility stands at 6.68%. The mix of signals points to turbulence after the gap down, with buyers showing some response near session highs.
Earlier, analysts noted that Fair Isaac was exhibiting persistent bearish momentum underpinned by sustained selling pressure across all major moving averages. The latest technical breakdown and increased volatility reinforce the negative outlook, with the prevailing scenario calling for close monitoring of the $885 support to gauge further downside risk.






Latest Fair Isaac Corporation News




-
 Afghanistan
-
 Albania
-
 Algeria
-
 Angola
-
 Argentina
-
 Armenia
-
 Australia
-
 Austria
-
 Azerbaijan
-
 Bahamas
-
 Bahrain
-
 Bangladesh
-
 Belarus
-
 Belgium
-
 Bolivia
-
 Botswana
-
 Brazil
-
 Brunei
-
 Bulgaria
-
 Cambodia
-
 Cameroon
-
 Canada
-
 Chile
-
 China
-
 Colombia
-
 Congo
-
 Costa Rica
-
 Cote d'Ivoire
-
 Croatia
-
 Cuba
-
 Cyprus
-
 Czechia
-
 DR Congo
-
 Denmark
-
 Dominican Republic
-
 Ecuador
-
 Egypt
-
 El Salvador
-
 Estonia
-
 Eswatini
-
 Ethiopia
-
 Finland
-
 France
-
 Georgia
-
 Germany
-
 Ghana
-
 Greece
-
 Haiti
-
 Hong Kong
-
 Hungary
-
 India
-
 Indonesia
-
 Iran, Islamic republic
-
 Iraq
-
 Ireland
-
 Israel
-
 Italy
-
 Jamaica
-
 Japan
-
 Jordan
-
 Kazakhstan
-
 Kenya
-
 Korea
-
 Kuwait
-
 Kyrgyzstan
-
 Laos
-
 Latvia
-
 Lebanon
-
 Lesotho
-
 Libya
-
 Lithuania
-
 Luxembourg
-
 Madagascar
-
 Malaysia
-
 Malta
-
 Mauritius
-
 Mexico
-
 Moldova
-
 Mongolia
-
 Montenegro
-
 Morocco
-
 Mozambique
-
 Myanmar
-
 Namibia
-
 Nepal
-
 Netherlands
-
 New Zealand
-
 Nigeria
-
 North Macedonia
-
 Norway
-
 Oman
-
 Pakistan
-
 Palestine
-
 Panama
-
 Papua New Guinea
-
 Paraguay
-
 Peru
-
 Philippines
-
 Poland
-
 Portugal
-
 Puerto Rico
-
 Qatar
-
 Reunion
-
 Romania
-
 Rwanda
-
 Saudi Arabia
-
 Serbia
-
 Singapore
-
 Slovakia
-
 Slovenia
-
 Somalia
-
 South Africa
-
 Spain
-
 Sri Lanka
-
 Sweden
-
 Switzerland
-
 Syria
-
 Taiwan
-
 Tajikistan
-
 Tanzania
-
 Thailand
-
 Trinidad and Tobago
-
 Tunisia
-
 Turkey
-
 UAE
-
 Uganda
-
 Ukraine
-
 United Kingdom
-
United States
-
 Uruguay
-
 Uzbekistan
-
 Venezuela
-
 Vietnam
-
 Yemen
-
 Zambia
-
 Zimbabwe
- Forex
- Crypto












