

AST SpaceMobile stock forecast: Support test shapes technical setup

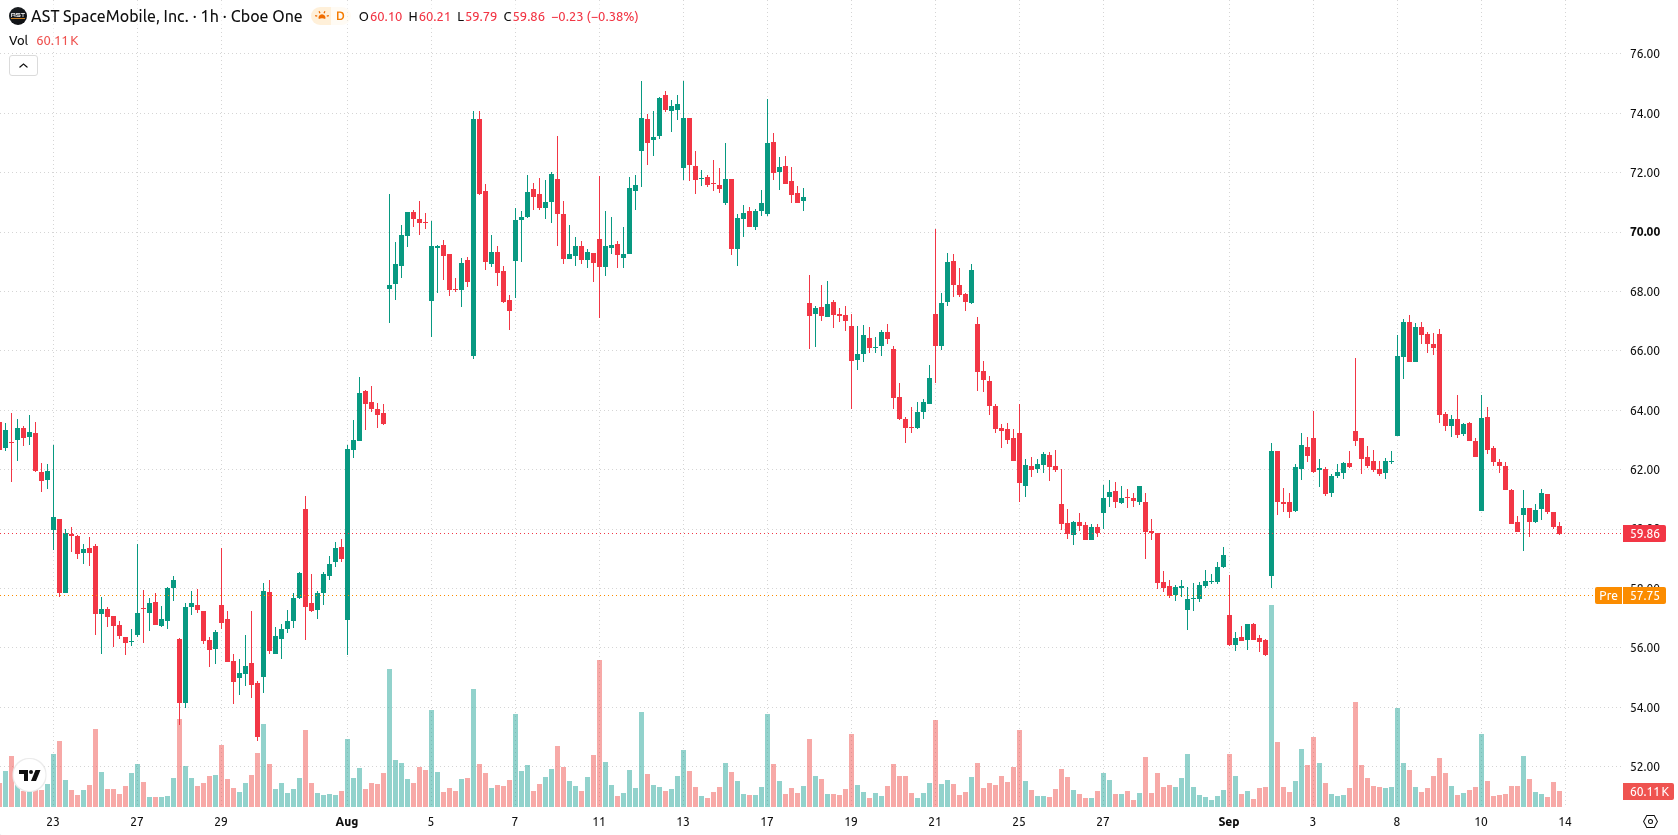
AST SpaceMobile (ASTS) stock is trading at $59.86 after a marginal daily decline. The price currently sits below its key moving averages, reflecting subdued near-term momentum.
 34.27
38.11
Highlights
- ASTS/USD trades below key moving averages, indicating persistent seller control across all timeframes.
- Momentum and oscillator signals are broadly bearish, with oversold readings and strong sell bias confirmed intraday.
- The expected trading range for the next 2 to 3 days spans $56.39 to $63.33, with very high downside probability if $56.39 support fails.
Sustained sell bias as technicals reinforce downside pressure
ASTS/USD is trading below its MA-20 at $61.74, MA-50 at $62.4, and MA-200 at $81.56, reflecting persistent pressure from sellers on all observed timeframes. The Ichimoku Kijun at $63.22 forms immediate resistance. Momentum indicators, including MACD and ADX, both signal a pronounced sell bias, while RSI, CCI, and Stochastic RSI show oversold readings. Bull/Bear Power continues to confirm seller dominance on the intraday chart, and the Awesome Oscillator remains neutral, with no divergences evident across oscillators.
Downward momentum likely as upside breakout probability stays minimal
Over the next two to three trading days, ASTS is likely to oscillate within a volatility band of $56.39 to $63.33. The probability of an upside break is seen as very low, while downward momentum remains highly probable. The baseline expectation is for price action to remain rangebound within the stated levels; a bullish scenario would require a decisive move above $63.22, while a breakdown below $56.39 could increase downside risk.
Earlier, analysts noted that AST SpaceMobile continued to exhibit technical weakness and elevated downside risk. Current trading confirms this persistent bearish bias, with traders advised to monitor the $56.39 support level for signs of further deterioration.






Latest AST SpaceMobile News



-
 Afghanistan
-
 Albania
-
 Algeria
-
 Angola
-
 Argentina
-
 Armenia
-
 Australia
-
 Austria
-
 Azerbaijan
-
 Bahamas
-
 Bahrain
-
 Bangladesh
-
 Belarus
-
 Belgium
-
 Bolivia
-
 Botswana
-
 Brazil
-
 Brunei
-
 Bulgaria
-
 Cambodia
-
 Cameroon
-
 Canada
-
 Chile
-
 China
-
 Colombia
-
 Congo
-
 Costa Rica
-
 Cote d'Ivoire
-
 Croatia
-
 Cuba
-
 Cyprus
-
 Czechia
-
 DR Congo
-
 Denmark
-
 Dominican Republic
-
 Ecuador
-
 Egypt
-
 El Salvador
-
 Estonia
-
 Eswatini
-
 Ethiopia
-
 Finland
-
 France
-
 Georgia
-
 Germany
-
 Ghana
-
 Greece
-
 Haiti
-
 Hong Kong
-
 Hungary
-
 India
-
 Indonesia
-
 Iran, Islamic republic
-
 Iraq
-
 Ireland
-
 Israel
-
 Italy
-
 Jamaica
-
 Japan
-
 Jordan
-
 Kazakhstan
-
 Kenya
-
 Korea
-
 Kuwait
-
 Kyrgyzstan
-
 Laos
-
 Latvia
-
 Lebanon
-
 Lesotho
-
 Libya
-
 Lithuania
-
 Luxembourg
-
 Madagascar
-
 Malaysia
-
 Malta
-
 Mauritius
-
 Mexico
-
 Moldova
-
 Mongolia
-
 Montenegro
-
 Morocco
-
 Mozambique
-
 Myanmar
-
 Namibia
-
 Nepal
-
 Netherlands
-
 New Zealand
-
 Nigeria
-
 North Macedonia
-
 Norway
-
 Oman
-
 Pakistan
-
 Palestine
-
 Panama
-
 Papua New Guinea
-
 Paraguay
-
 Peru
-
 Philippines
-
 Poland
-
 Portugal
-
 Puerto Rico
-
 Qatar
-
 Reunion
-
 Romania
-
 Rwanda
-
 Saudi Arabia
-
 Serbia
-
 Singapore
-
 Slovakia
-
 Slovenia
-
 Somalia
-
 South Africa
-
 Spain
-
 Sri Lanka
-
 Sweden
-
 Switzerland
-
 Syria
-
 Taiwan
-
 Tajikistan
-
 Tanzania
-
 Thailand
-
 Trinidad and Tobago
-
 Tunisia
-
 Turkey
-
 UAE
-
 Uganda
-
 Ukraine
-
 United Kingdom
-
United States
-
 Uruguay
-
 Uzbekistan
-
 Venezuela
-
 Vietnam
-
 Yemen
-
 Zambia
-
 Zimbabwe
- Forex
- Crypto












