

What's behind Barrick Gold's latest 3.2% stock pullback?

Barrick Gold Corporation (ABX) dropped 3.21% on sustained technical selling pressure, as early downside momentum and a persistent bearish structure weighed on intraday sentiment. The move appears limited, with mixed momentum signals and the stock trading below both its 20-day and 200-day moving averages, while holding above the 50-day average.
 60.46
60.46
Highlights
- Shares of Barrick Gold trade below the 20-day and 200-day moving averages, indicating broad bearish alignment despite holding above the 50-day average.
- Technical indicators present mixed momentum, with MACD and RSI skewed positive, but Stochastic RSI and Bull/Bear Power both show oversold conditions amid neutral ADX and CCI signals.
- Over the next five sessions, projected price range is C$57.21 to C$60.36, with a 67% probability of an upward move if resistance at C$58.84 is cleared.
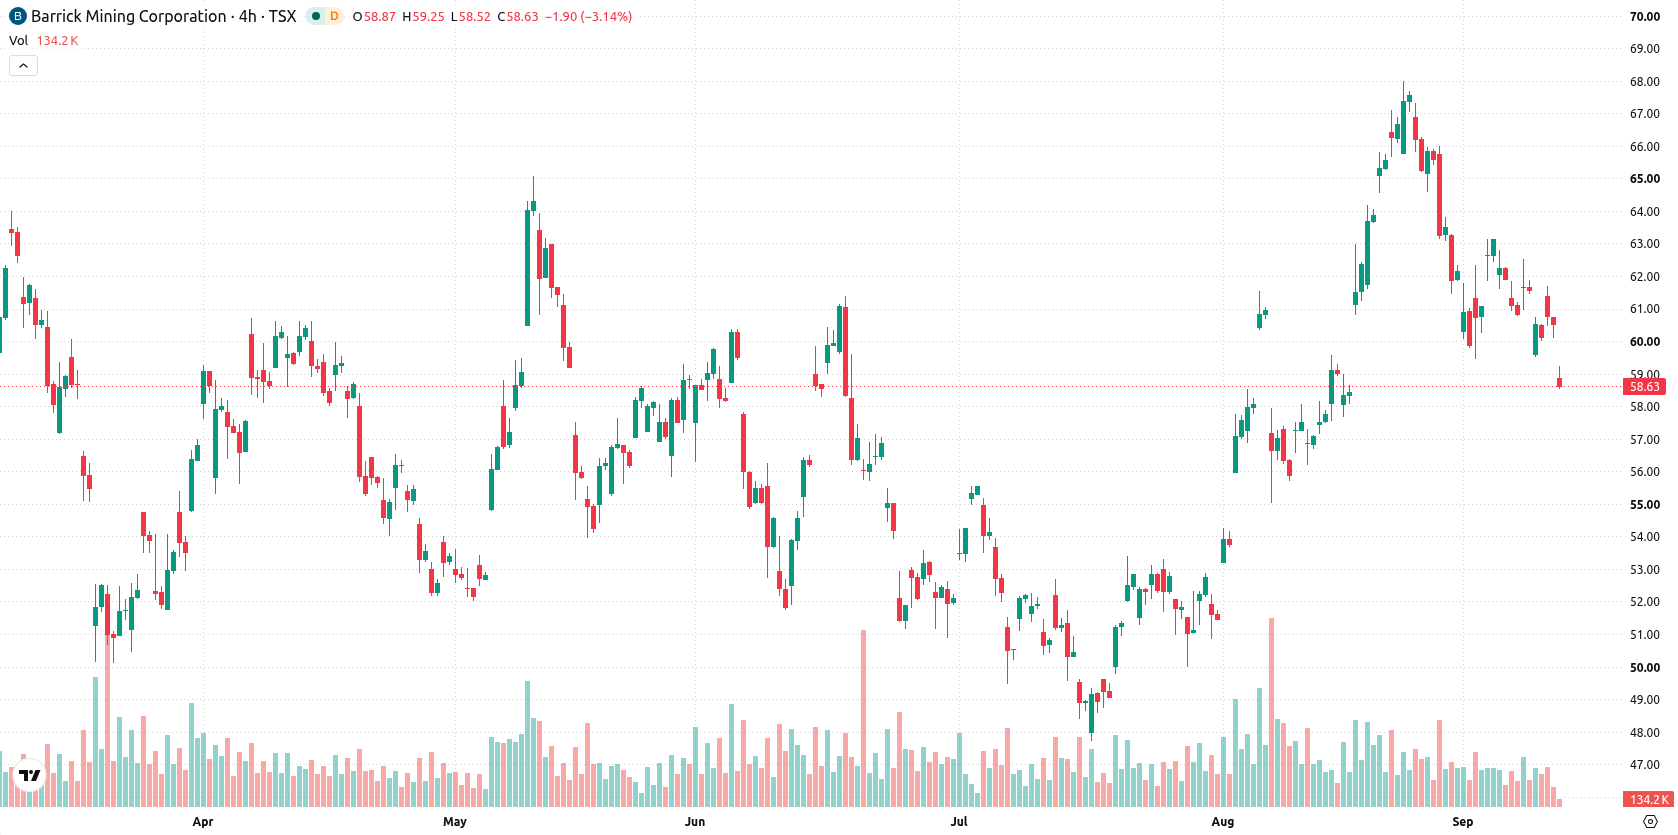
Diverging momentum signals as short- and long-term sellers dominate
Barrick Gold is positioned below the 20-day moving average (C$62.33) and the 200-day moving average (C$59.13), but remains above the 50-day moving average (C$56.87). This alignment indicates both short- and long-term negative pressure from sellers, while the medium-term trend shows some resilience. Key technical levels are resistance at C$58.84 and support at C$57.21. Momentum readings are mixed: the MACD signals 'Strong Buy,' RSI implies a 'Buy' stance, and BBP remains positive at 0.21, reflecting oversold conditions. Stochastic RSI is also oversold. ADX, CCI, and the Awesome Oscillator all read neutral, highlighting diverging momentum signals. The stock has seen significant early selling following a downside opening gap.
Earlier, analysts noted that Barrick Gold’s technical outlook was dominated by cautious, rangebound trading and persistent downside momentum. The current analysis adds a layer of complexity with mixed momentum indicators and recent downside pressure, making resistance at C$58.84 a key level for traders to monitor for a potential directional breakout.






Latest Barrick Gold News





-
 Afghanistan
-
 Albania
-
 Algeria
-
 Angola
-
 Argentina
-
 Armenia
-
 Australia
-
 Austria
-
 Azerbaijan
-
 Bahamas
-
 Bahrain
-
 Bangladesh
-
 Belarus
-
 Belgium
-
 Bolivia
-
 Botswana
-
 Brazil
-
 Brunei
-
 Bulgaria
-
 Cambodia
-
 Cameroon
-
 Canada
-
 Chile
-
 China
-
 Colombia
-
 Congo
-
 Costa Rica
-
 Cote d'Ivoire
-
 Croatia
-
 Cuba
-
 Cyprus
-
 Czechia
-
 DR Congo
-
 Denmark
-
 Dominican Republic
-
 Ecuador
-
 Egypt
-
 El Salvador
-
 Estonia
-
 Eswatini
-
 Ethiopia
-
 Finland
-
 France
-
 Georgia
-
 Germany
-
 Ghana
-
 Greece
-
 Haiti
-
 Hong Kong
-
 Hungary
-
 India
-
 Indonesia
-
 Iran, Islamic republic
-
 Iraq
-
 Ireland
-
 Israel
-
 Italy
-
 Jamaica
-
 Japan
-
 Jordan
-
 Kazakhstan
-
 Kenya
-
 Korea
-
 Kuwait
-
 Kyrgyzstan
-
 Laos
-
 Latvia
-
 Lebanon
-
 Lesotho
-
 Libya
-
 Lithuania
-
 Luxembourg
-
 Madagascar
-
 Malaysia
-
 Malta
-
 Mauritius
-
 Mexico
-
 Moldova
-
 Mongolia
-
 Montenegro
-
 Morocco
-
 Mozambique
-
 Myanmar
-
 Namibia
-
 Nepal
-
 Netherlands
-
 New Zealand
-
 Nigeria
-
 North Macedonia
-
 Norway
-
 Oman
-
 Pakistan
-
 Palestine
-
 Panama
-
 Papua New Guinea
-
 Paraguay
-
 Peru
-
 Philippines
-
 Poland
-
 Portugal
-
 Puerto Rico
-
 Qatar
-
 Reunion
-
 Romania
-
 Rwanda
-
 Saudi Arabia
-
 Serbia
-
 Singapore
-
 Slovakia
-
 Slovenia
-
 Somalia
-
 South Africa
-
 Spain
-
 Sri Lanka
-
 Sweden
-
 Switzerland
-
 Syria
-
 Taiwan
-
 Tajikistan
-
 Tanzania
-
 Thailand
-
 Trinidad and Tobago
-
 Tunisia
-
 Turkey
-
 UAE
-
 Uganda
-
 Ukraine
-
 United Kingdom
-
United States
-
 Uruguay
-
 Uzbekistan
-
 Venezuela
-
 Vietnam
-
 Yemen
-
 Zambia
-
 Zimbabwe
- Forex
- Crypto












