

ServiceNow stock weekly forecast: Extends recovery but faces overbought risk

Shares of ServiceNow Inc. (NOW) are trading near $139 after gaining over 4% in the past week, as positive sentiment builds on strong quarterly results and expansion momentum. The recent rally puts NOW at the upper end of its range, but with price now in overbought territory, traders will be closely watching for any reversal signals or fresh catalysts to set direction in the week ahead.
 93.21
102.83
Highlights
- Shares of ServiceNow have gained 4.57% over the past seven days, trading firmly above near-term trend averages.
- Technical indicators present mixed messages, with momentum bullish overall but some signals nearing oversold readings, pointing to possible short-term swings.
- Expected trading range for the coming week is $136.13 to $141.14, with key support at $135.6 and no defined overhead resistance.
Revenue and AI adoption lift sentiment as security risks linger
NOW was boosted after reporting Q2 2026 revenue of $3.99 billion, up 24% year-over-year, and earnings per share of $0.90, both topping expectations according to www.ad-hoc-news.de and The Markets Daily. The company underlined robust demand and faster AI solution uptake at Citi’s 2026 Global TMT Conference, yet acknowledged lingering customer concerns around security and governance, as noted by Investing.com. Additionally, NOW extended its integration with Genesys by deepening its workflow platform role within the Genesys customer experience stack, as reported by Simply Wall St News.
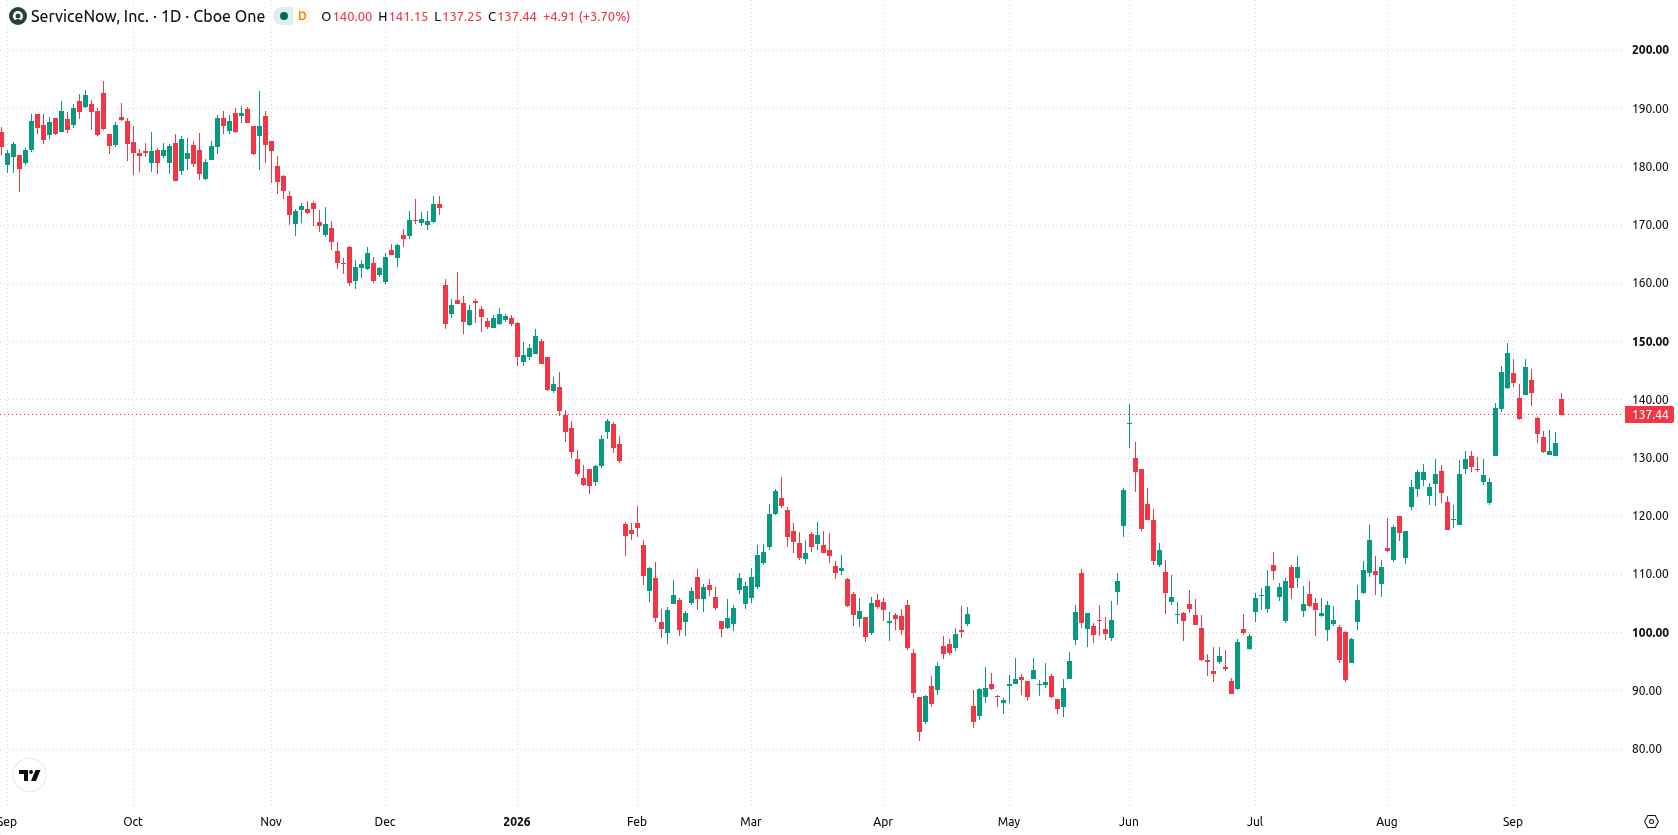
Bullish MACD diverges from oversold momentum after contained weekly range
On the daily chart, the trend is flat, with price settled at the top of the recent range following a contained move within a narrow range and volatility ticking in at 3.8%. Momentum signals send mixed messages: MACD remains firmly in a bullish stance with a value of 4.86, while Stochastic RSI is oversold at 5.51, highlighting a divergence between trend continuation and the potential for a near-term bounce. Key support is set at $135.6, closely followed by the Ichimoku Kijun at $130.64, both acting as buffers on the downside, while price currently lacks a defined resistance overhead.
Bullish bias holds if support survives but breakout risks emerge next week
Over the coming trading week, ServiceNow shares are expected to trade within a range of $136.13 to $141.14. There is a 70% probability of an increase and a 30% probability of a decrease. The base case sees the stock consolidating inside these boundaries with bias dictated by price action near $135.6 support. A breakout above $141.14 would open up bullish potential, while a reversal below $135.6 may lead to a deeper pullback toward the Ichimoku Kijun at $130.64.
Earlier, analysts noted that ServiceNow was exhibiting greater downside risk, with sellers in control amid short-term technical uncertainty. The recent rally and solid earnings signal a shift toward consolidation at higher levels, making $135.6 a critical support zone to monitor for potential reversal or breakout opportunities.






Latest ServiceNow News



-
 Afghanistan
-
 Albania
-
 Algeria
-
 Angola
-
 Argentina
-
 Armenia
-
 Australia
-
 Austria
-
 Azerbaijan
-
 Bahamas
-
 Bahrain
-
 Bangladesh
-
 Belarus
-
 Belgium
-
 Bolivia
-
 Botswana
-
 Brazil
-
 Brunei
-
 Bulgaria
-
 Cambodia
-
 Cameroon
-
 Canada
-
 Chile
-
 China
-
 Colombia
-
 Congo
-
 Costa Rica
-
 Cote d'Ivoire
-
 Croatia
-
 Cuba
-
 Cyprus
-
 Czechia
-
 DR Congo
-
 Denmark
-
 Dominican Republic
-
 Ecuador
-
 Egypt
-
 El Salvador
-
 Estonia
-
 Eswatini
-
 Ethiopia
-
 Finland
-
 France
-
 Georgia
-
 Germany
-
 Ghana
-
 Greece
-
 Haiti
-
 Hong Kong
-
 Hungary
-
 India
-
 Indonesia
-
 Iran, Islamic republic
-
 Iraq
-
 Ireland
-
 Israel
-
 Italy
-
 Jamaica
-
 Japan
-
 Jordan
-
 Kazakhstan
-
 Kenya
-
 Korea
-
 Kuwait
-
 Kyrgyzstan
-
 Laos
-
 Latvia
-
 Lebanon
-
 Lesotho
-
 Libya
-
 Lithuania
-
 Luxembourg
-
 Madagascar
-
 Malaysia
-
 Malta
-
 Mauritius
-
 Mexico
-
 Moldova
-
 Mongolia
-
 Montenegro
-
 Morocco
-
 Mozambique
-
 Myanmar
-
 Namibia
-
 Nepal
-
 Netherlands
-
 New Zealand
-
 Nigeria
-
 North Macedonia
-
 Norway
-
 Oman
-
 Pakistan
-
 Palestine
-
 Panama
-
 Papua New Guinea
-
 Paraguay
-
 Peru
-
 Philippines
-
 Poland
-
 Portugal
-
 Puerto Rico
-
 Qatar
-
 Reunion
-
 Romania
-
 Rwanda
-
 Saudi Arabia
-
 Serbia
-
 Singapore
-
 Slovakia
-
 Slovenia
-
 Somalia
-
 South Africa
-
 Spain
-
 Sri Lanka
-
 Sweden
-
 Switzerland
-
 Syria
-
 Taiwan
-
 Tajikistan
-
 Tanzania
-
 Thailand
-
 Trinidad and Tobago
-
 Tunisia
-
 Turkey
-
 UAE
-
 Uganda
-
 Ukraine
-
 United Kingdom
-
United States
-
 Uruguay
-
 Uzbekistan
-
 Venezuela
-
 Vietnam
-
 Yemen
-
 Zambia
-
 Zimbabwe
- Forex
- Crypto












