

Rising Treasury yields pressure financial sector: Can Goldman Sachs stock hold $954.10 support?

Goldman Sachs Group, Inc. (GS) stock is trading at $955.76, marking a daily decline of 3.29%. The price is currently below its key moving averages and sits near the day's low, reflecting a strong downward movement.
 906.89
939.28
Highlights
- Goldman Sachs faces increased sector pressure as macroeconomic shifts and changing Federal Reserve expectations raise borrowing costs and constrain earnings potential.
- Annual revenue reached $117.10 billion and net profit was $16.30 billion, indicating resilient core results despite market headwinds.
- Shares of Goldman Sachs trade below short- and medium-term moving averages with bearish momentum indicators, with support near $929.69 and most likely price action expected between $929.69 to $981.83.
Profit resilience as macro headwinds pressure Goldman Sachs
Goldman Sachs recently faced heightened volatility as macroeconomic shifts and evolving Federal Reserve expectations led to a challenging environment for financial stocks, with higher borrowing costs and rising Treasury yields pressuring the sector, according to Tradingkey. These macro-driven headwinds have elevated the cost of capital and compressed earnings potential for firms like Goldman Sachs. The company reported annual revenue of $117.10 billion and net profit of $16.30 billion, underscoring resilient core operations despite unfavorable market conditions.
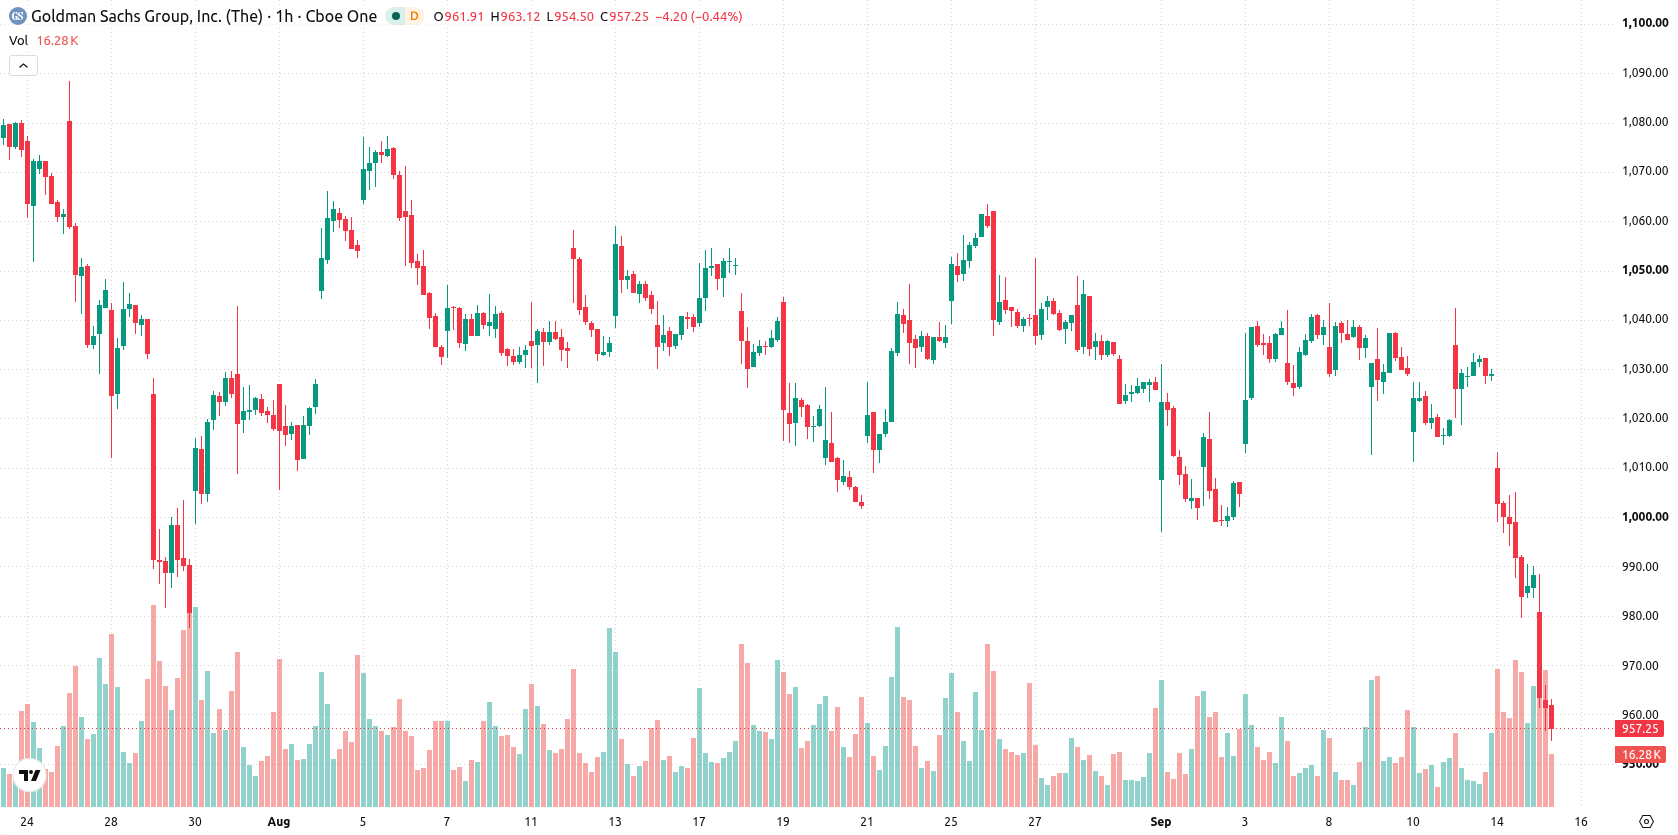
Support holds as technical indicators flash oversold signals
GS is currently trading below the MA-20 at $1,013 and MA-50 at $1,025. The MA-200 at $954.1 offers the closest long-term support, with the Ichimoku Kijun at $1,010 forming immediate resistance. RSI is at 27.37, while Stoch RSI, CCI, and Bull/Bear Power all register in oversold or sell territory, indicating intraday seller dominance. Both MACD and ADX deliver bearish momentum signals, and the Awesome Oscillator reinforces this negative outlook, with the price action underpinned by moderate volatility.
Downside risk favored as breakout levels define outlook
Over the next few sessions, GS is expected to remain within a volatility band of $929.69 to $981.83. The probability of an upward move is estimated at 22%, while a downside scenario holds a 78% likelihood, suggesting any reversal is unlikely. A breakout above $1,010 would be needed to confirm a bullish shift, while decisive losses below $929.69 would indicate further downside risk. Sideways trading within the established range remains the baseline scenario.
Earlier, analysts noted that Goldman Sachs was exhibiting a neutral-to-bearish technical structure amid persistent macroeconomic headwinds and a challenging Fed policy environment. The latest data reinforces this view, highlighting a prevailing downside risk scenario and positioning $929.69 as a crucial support level for traders to monitor in the near term.






Latest Goldman Sachs News




-
 Afghanistan
-
 Albania
-
 Algeria
-
 Angola
-
 Argentina
-
 Armenia
-
 Australia
-
 Austria
-
 Azerbaijan
-
 Bahamas
-
 Bahrain
-
 Bangladesh
-
 Belarus
-
 Belgium
-
 Bolivia
-
 Botswana
-
 Brazil
-
 Brunei
-
 Bulgaria
-
 Cambodia
-
 Cameroon
-
 Canada
-
 Chile
-
 China
-
 Colombia
-
 Congo
-
 Costa Rica
-
 Cote d'Ivoire
-
 Croatia
-
 Cuba
-
 Cyprus
-
 Czechia
-
 DR Congo
-
 Denmark
-
 Dominican Republic
-
 Ecuador
-
 Egypt
-
 El Salvador
-
 Estonia
-
 Eswatini
-
 Ethiopia
-
 Finland
-
 France
-
 Georgia
-
 Germany
-
 Ghana
-
 Greece
-
 Haiti
-
 Hong Kong
-
 Hungary
-
 India
-
 Indonesia
-
 Iran, Islamic republic
-
 Iraq
-
 Ireland
-
 Israel
-
 Italy
-
 Jamaica
-
 Japan
-
 Jordan
-
 Kazakhstan
-
 Kenya
-
 Korea
-
 Kuwait
-
 Kyrgyzstan
-
 Laos
-
 Latvia
-
 Lebanon
-
 Lesotho
-
 Libya
-
 Lithuania
-
 Luxembourg
-
 Madagascar
-
 Malaysia
-
 Malta
-
 Mauritius
-
 Mexico
-
 Moldova
-
 Mongolia
-
 Montenegro
-
 Morocco
-
 Mozambique
-
 Myanmar
-
 Namibia
-
 Nepal
-
 Netherlands
-
 New Zealand
-
 Nigeria
-
 North Macedonia
-
 Norway
-
 Oman
-
 Pakistan
-
 Palestine
-
 Panama
-
 Papua New Guinea
-
 Paraguay
-
 Peru
-
 Philippines
-
 Poland
-
 Portugal
-
 Puerto Rico
-
 Qatar
-
 Reunion
-
 Romania
-
 Rwanda
-
 Saudi Arabia
-
 Serbia
-
 Singapore
-
 Slovakia
-
 Slovenia
-
 Somalia
-
 South Africa
-
 Spain
-
 Sri Lanka
-
 Sweden
-
 Switzerland
-
 Syria
-
 Taiwan
-
 Tajikistan
-
 Tanzania
-
 Thailand
-
 Trinidad and Tobago
-
 Tunisia
-
 Turkey
-
 UAE
-
 Uganda
-
 Ukraine
-
 United Kingdom
-
United States
-
 Uruguay
-
 Uzbekistan
-
 Venezuela
-
 Vietnam
-
 Yemen
-
 Zambia
-
 Zimbabwe
- Forex
- Crypto












