

What's behind Goldman Sachs's latest 3.0% stock pullback?

Goldman Sachs Group, Inc. (GS) fell 3.02% as macroeconomic volatility and heightened borrowing costs pressured the stock amid shifting Federal Reserve expectations. The decline is supported by a weak technical structure, with the stock remaining below its short- and medium-term moving averages and sellers holding momentum control.
 904.11
939.28
Highlights
- Goldman Sachs reported annual revenue of $117.10 billion with net profit of $16.30 billion as results declined.
- Market volatility, shifting Federal Reserve policy, and rising Treasury yields have increased borrowing costs for major financial firms.
- Shares of Goldman Sachs trade below key short-term moving averages with technical momentum negative and a projected range of $929.32 to $987.61 for the next five days.
Revenue and profit drop as central bank tightening raises costs
Goldman Sachs recorded annual revenue of $117.10 billion and a net profit of $16.30 billion. The decline was attributed to market volatility and changing expectations regarding Federal Reserve policy, with rising Treasury yields increasing borrowing costs for major financial companies. Persistent central bank tightening has also raised global corporate borrowing expenses, which may influence core activities such as debt underwriting and advisory services.
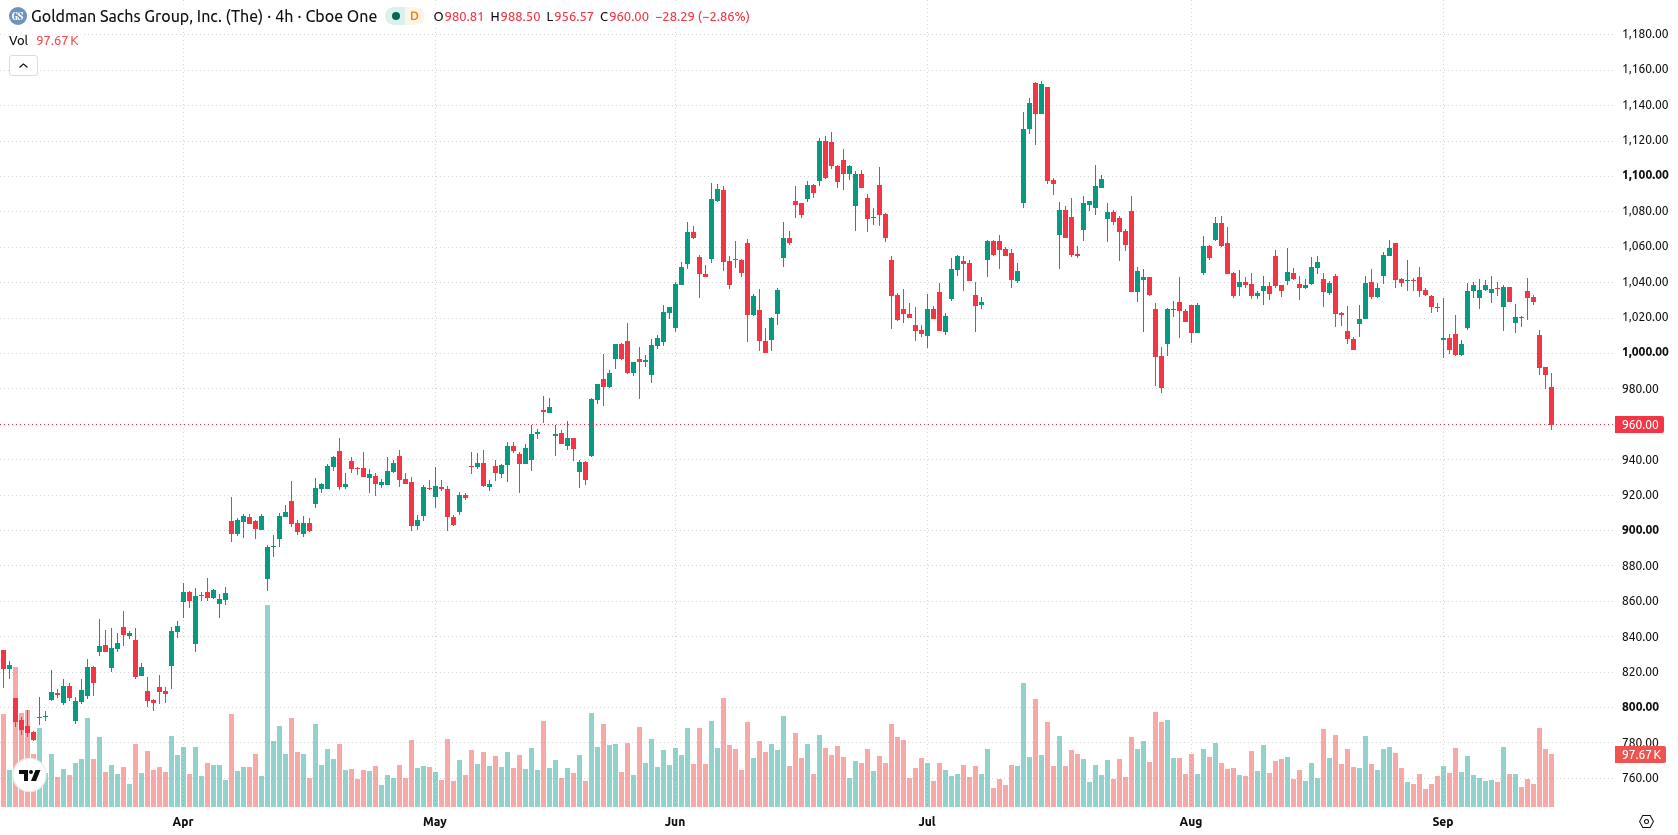
Sell momentum persists as oversold signals and weak trend converge
GS is trading below its 20-day and 50-day moving averages at $1,029 and $1,043, but remains just above the 200-day at $954.1, indicating seller control in the short-to-medium term while retaining a longer-term bullish bias. The nearest resistance is $960.95, with support at $954.1. Momentum indicators, including MACD and RSI, signal a sell bias; ADX at 9.74 reflects a lack of trend strength. Stochastic RSI and CCI point to oversold conditions, and intraday momentum is dominated by sellers, as confirmed by negative Bull/Bear Power readings. Intraday volatility is at 1.59%, with the stock trading near session lows and pressured by recent downside momentum.
Earlier, analysts noted that Goldman Sachs shares were exhibiting a neutral-to-bearish technical structure amid prevailing market uncertainty. The current analysis reinforces this outlook, underscoring the importance of watching for a break below $954.1 as a potential trigger for additional downside risk.






Latest Goldman Sachs News




-
 Afghanistan
-
 Albania
-
 Algeria
-
 Angola
-
 Argentina
-
 Armenia
-
 Australia
-
 Austria
-
 Azerbaijan
-
 Bahamas
-
 Bahrain
-
 Bangladesh
-
 Belarus
-
 Belgium
-
 Bolivia
-
 Botswana
-
 Brazil
-
 Brunei
-
 Bulgaria
-
 Cambodia
-
 Cameroon
-
 Canada
-
 Chile
-
 China
-
 Colombia
-
 Congo
-
 Costa Rica
-
 Cote d'Ivoire
-
 Croatia
-
 Cuba
-
 Cyprus
-
 Czechia
-
 DR Congo
-
 Denmark
-
 Dominican Republic
-
 Ecuador
-
 Egypt
-
 El Salvador
-
 Estonia
-
 Eswatini
-
 Ethiopia
-
 Finland
-
 France
-
 Georgia
-
 Germany
-
 Ghana
-
 Greece
-
 Haiti
-
 Hong Kong
-
 Hungary
-
 India
-
 Indonesia
-
 Iran, Islamic republic
-
 Iraq
-
 Ireland
-
 Israel
-
 Italy
-
 Jamaica
-
 Japan
-
 Jordan
-
 Kazakhstan
-
 Kenya
-
 Korea
-
 Kuwait
-
 Kyrgyzstan
-
 Laos
-
 Latvia
-
 Lebanon
-
 Lesotho
-
 Libya
-
 Lithuania
-
 Luxembourg
-
 Madagascar
-
 Malaysia
-
 Malta
-
 Mauritius
-
 Mexico
-
 Moldova
-
 Mongolia
-
 Montenegro
-
 Morocco
-
 Mozambique
-
 Myanmar
-
 Namibia
-
 Nepal
-
 Netherlands
-
 New Zealand
-
 Nigeria
-
 North Macedonia
-
 Norway
-
 Oman
-
 Pakistan
-
 Palestine
-
 Panama
-
 Papua New Guinea
-
 Paraguay
-
 Peru
-
 Philippines
-
 Poland
-
 Portugal
-
 Puerto Rico
-
 Qatar
-
 Reunion
-
 Romania
-
 Rwanda
-
 Saudi Arabia
-
 Serbia
-
 Singapore
-
 Slovakia
-
 Slovenia
-
 Somalia
-
 South Africa
-
 Spain
-
 Sri Lanka
-
 Sweden
-
 Switzerland
-
 Syria
-
 Taiwan
-
 Tajikistan
-
 Tanzania
-
 Thailand
-
 Trinidad and Tobago
-
 Tunisia
-
 Turkey
-
 UAE
-
 Uganda
-
 Ukraine
-
 United Kingdom
-
United States
-
 Uruguay
-
 Uzbekistan
-
 Venezuela
-
 Vietnam
-
 Yemen
-
 Zambia
-
 Zimbabwe
- Forex
- Crypto












