

Goldman Sachs stock drops more than 2% after major pension funds reduce positions

Goldman Sachs Group, Inc. (GS) slid 2.12% after institutional investors and ETFs cut back their holdings, accompanied by sizable net sales on November 16 and reductions from major pension managers. The down move is supported by Goldman Sachs trading below all key moving averages, with near-term resistance anchored above current price levels.
 889.97
920.47
Highlights
- Institutional flows were mixed in the third quarter as the Public Sector Pension Investment Board cut its Goldman Sachs stake by 45.4% while Cibc World Market Inc. raised holdings by 1.2%.
- Goldman Sachs reported trailing-12-month revenue of $70.87 billion, a net margin of 31.3%, a P/E ratio of about 12.6, and issued a $20.00 annualized dividend yielding 2.1%.
- Goldman Sachs stock trades below all key moving averages with prevailing bearish momentum, a projected five-day range of $826.69 to $882.7, and a high probability of further downside.
Pension divestment and ETF outflows reinforce sustained selling pressure
Institutional investors recently changed their positions in Goldman Sachs, with the Public Sector Pension Investment Board significantly decreasing its stake by 45.4% in the third quarter and Cibc World Market Inc. increasing its holdings by 1.2%. On November 16, ETFs were net sellers of Goldman Sachs, with a net sale value of $47.7 million. The company reported trailing-12-month revenue of $70.87 billion and a net margin of 31.3%, is trading at a P/E ratio of approximately 12.6, and declared an annualized dividend of $20.00 per share with a yield of about 2.1%. The dividend payout ratio is 28.76% and year-to-date stock return is 1.29%, though price action has remained under broader selling pressure.
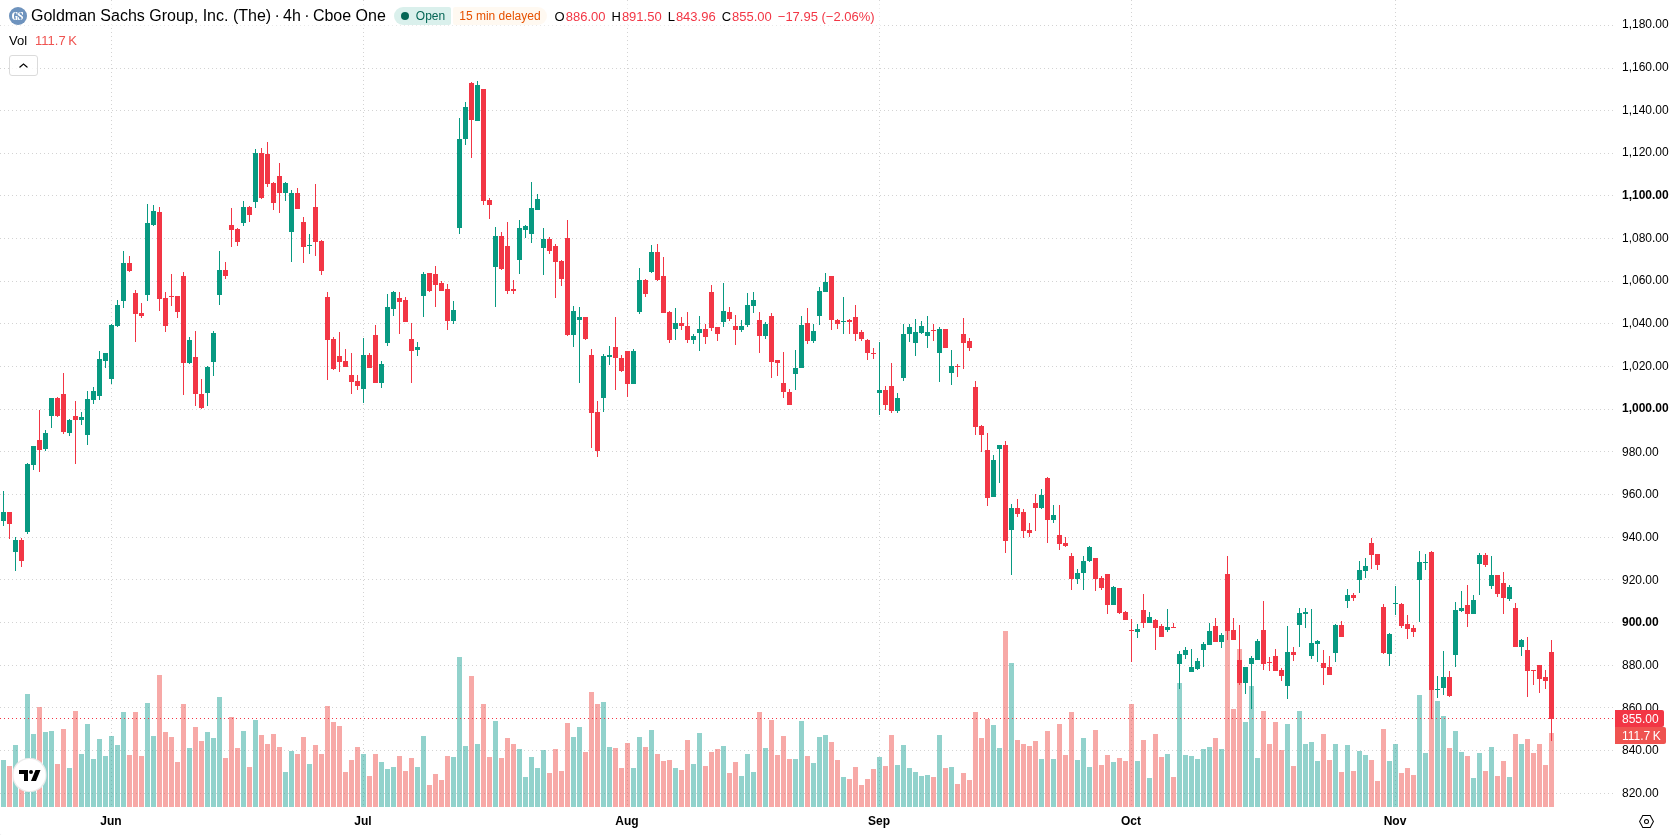
Bearish momentum as price stays under moving averages and weakens further
Goldman Sachs is trading below all key moving averages, with the current price of $854.69 beneath the 20-day ($899.66), 50-day ($912.61), and 200-day ($954.89) levels, signaling prevailing weakness across short, medium, and long-term timeframes. The immediate resistance level is identified at $864.46, while support rests at $826.69. The 50-day average remaining under the 200-day reflects a sustained bearish medium- to long-term trend. Technical indicators show largely negative momentum: MACD is issuing a sell signal and the ADX at 14.52 points to weak trend strength. RSI is neutral, but both the Stochastic RSI and Commodity Channel Index (CCI) are in the oversold range. Bull/Bear Power (BBP) registers a bearish -16.77, and the Awesome Oscillator is neutral. Price dropped sharply by $18.50 after opening an upside gap of $6.82, with session volatility at 1.59% and pronounced selling momentum since the open.
Previously it was reported that analysts flagged oversold technicals and notable institutional flow shifts as key drivers of potential rebound risk for Goldman Sachs shares. Fresh outflows from major ETFs and pension funds now reinforce the prevailing downside scenario, making the $826.69 support level pivotal for traders assessing near-term risk.






Latest Goldman Sachs News




-
 Afghanistan
-
 Albania
-
 Algeria
-
 Angola
-
 Argentina
-
 Armenia
-
 Australia
-
 Austria
-
 Azerbaijan
-
 Bahamas
-
 Bahrain
-
 Bangladesh
-
 Belarus
-
 Belgium
-
 Bolivia
-
 Botswana
-
 Brazil
-
 Brunei
-
 Bulgaria
-
 Cambodia
-
 Cameroon
-
 Canada
-
 Chile
-
 China
-
 Colombia
-
 Congo
-
 Costa Rica
-
 Cote d'Ivoire
-
 Croatia
-
 Cuba
-
 Cyprus
-
 Czechia
-
 DR Congo
-
 Denmark
-
 Dominican Republic
-
 Ecuador
-
 Egypt
-
 El Salvador
-
 Estonia
-
 Eswatini
-
 Ethiopia
-
 Finland
-
 France
-
 Georgia
-
 Germany
-
 Ghana
-
 Greece
-
 Haiti
-
 Hong Kong
-
 Hungary
-
 India
-
 Indonesia
-
 Iran, Islamic republic
-
 Iraq
-
 Ireland
-
 Israel
-
 Italy
-
 Jamaica
-
 Japan
-
 Jordan
-
 Kazakhstan
-
 Kenya
-
 Korea
-
 Kuwait
-
 Kyrgyzstan
-
 Laos
-
 Latvia
-
 Lebanon
-
 Lesotho
-
 Libya
-
 Lithuania
-
 Luxembourg
-
 Madagascar
-
 Malaysia
-
 Malta
-
 Mauritius
-
 Mexico
-
 Moldova
-
 Mongolia
-
 Montenegro
-
 Morocco
-
 Mozambique
-
 Myanmar
-
 Namibia
-
 Nepal
-
 Netherlands
-
 New Zealand
-
 Nigeria
-
 North Macedonia
-
 Norway
-
 Oman
-
 Pakistan
-
 Palestine
-
 Panama
-
 Papua New Guinea
-
 Paraguay
-
 Peru
-
 Philippines
-
 Poland
-
 Portugal
-
 Puerto Rico
-
 Qatar
-
 Reunion
-
 Romania
-
 Rwanda
-
 Saudi Arabia
-
 Serbia
-
 Singapore
-
 Slovakia
-
 Slovenia
-
 Somalia
-
 South Africa
-
 Spain
-
 Sri Lanka
-
 Sweden
-
 Switzerland
-
 Syria
-
 Taiwan
-
 Tajikistan
-
 Tanzania
-
 Thailand
-
 Trinidad and Tobago
-
 Tunisia
-
 Turkey
-
 UAE
-
 Uganda
-
 Ukraine
-
 United Kingdom
-
United States
-
 Uruguay
-
 Uzbekistan
-
 Venezuela
-
 Vietnam
-
 Yemen
-
 Zambia
-
 Zimbabwe
- Forex
- Crypto












