

Goldman Sachs stock decline reaches oversold territory with rebound risk: weekly outlook

Shares of Goldman Sachs Group, Inc. (GS) are trading near $885, after falling around 3% over the past week amid distinct institutional flow shifts. Upbeat institutional positioning and capital reallocation have helped to stabilize sentiment, but oversold conditions introduce uncertainty for the days ahead.
 880.00
920.47
Highlights
- Shares of Goldman Sachs fell 3.25% over the past week to $885.13 and trade below key moving averages.
- The stock sits in a narrow range with volatility at 6.48%, and technical signals show oversold conditions that may indicate selling exhaustion.
- For the next five sessions, price is projected to move between $852.49 and $910.17, with high downside probability unless $897.14 is reclaimed.
Institutional reallocation surges as equity and ETF exposures realign for the week
Recent regulatory filings revealed that Goldman Sachs held approximately $1.28 billion in spot Bitcoin ETF positions as of the end of the third quarter of 2026, reflecting a move to more than double its previous holdings, according to Yahoo Finance. Banco Santander S.A. also increased its stake in GS by 42.8% during the third quarter, further highlighting shifts in institutional capital allocation. Ongoing evaluation of equity and ETF exposures remains a central theme for institutional flows and positioning in the coming week.
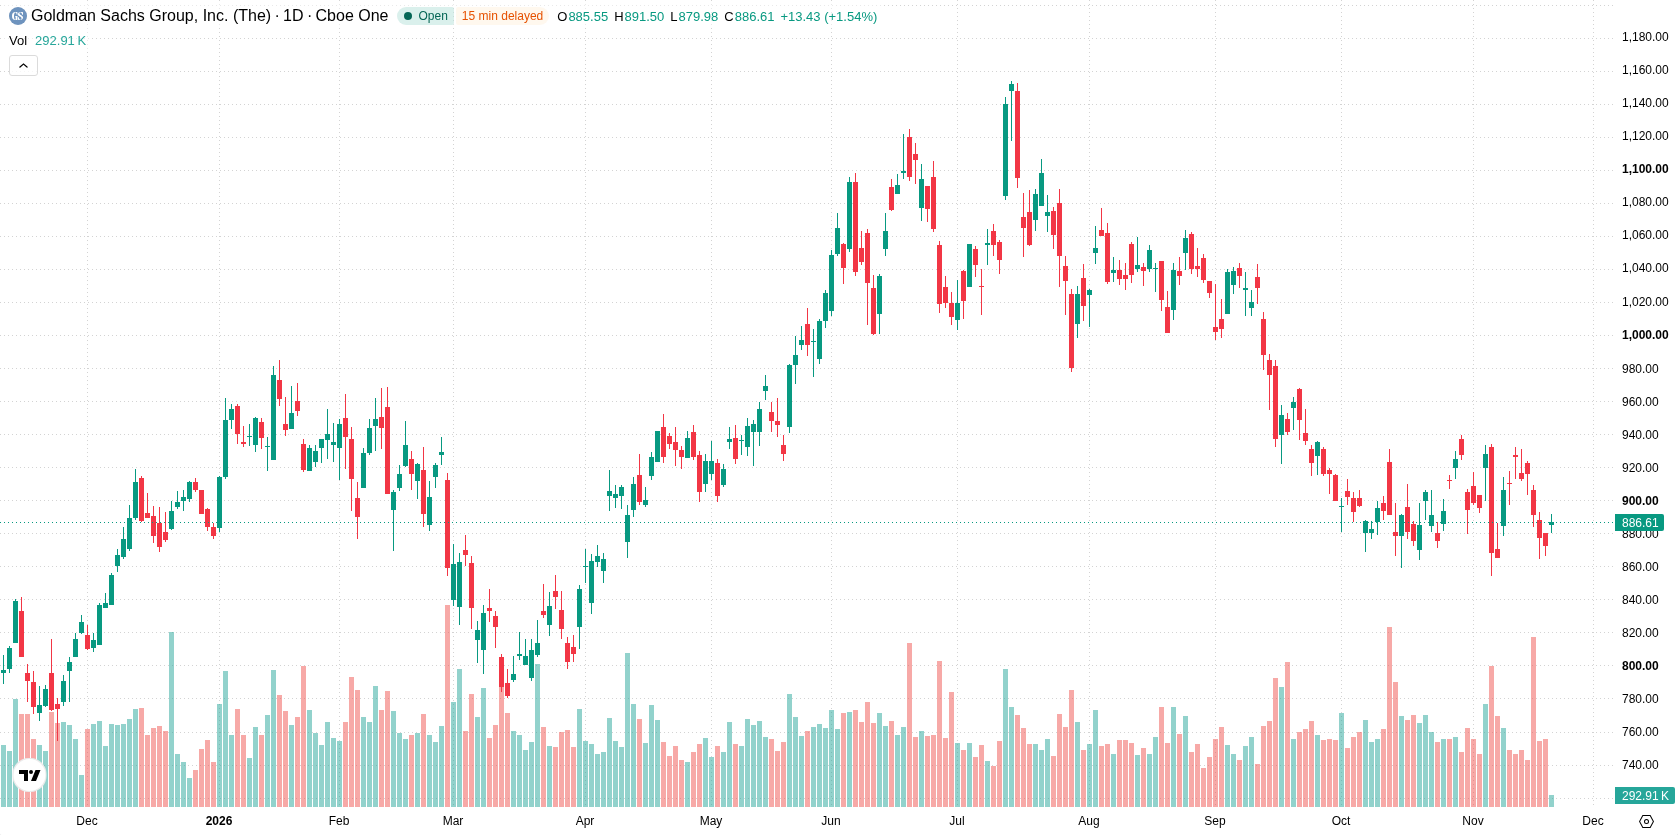
Oversold technicals flag rebound risk despite persistent downside pressure this week
The daily chart shows a contained move within a narrow range, with volatility at 6.48%. MACD remains in sell territory, while CCI and Stochastic RSI are both indicating oversold conditions, which may signal selling exhaustion and potential for a rebound. Price is situated above support at $864.46 and beneath resistance at $897.14, defined by the Ichimoku Kijun line. The structure points to continued pressure, but oversold readings introduce rebound risk if buyers step in.
Downside bias prevails as breakout risks shape the weekly forecast
For the next five trading days, the expected range is $852.49 to $910.17. There is a very low probability of an increase and a very high probability of a decrease. The base case scenario is a contained move between $864.46 and $897.14. A close above $897.14 would target a push toward the upper end of the range at $910.17, while a break below $864.46 opens the door to a test of $852.49.
Previously it was reported that Goldman Sachs more than doubled its holdings in U.S. spot Bitcoin ETFs during the third quarter, signifying a notable shift in its digital asset exposure. With Banco Santander's increased stake and ongoing capital allocation adjustments highlighted in recent filings, traders should closely monitor GS's behavior around the $864.46 support and $897.14 resistance in the days ahead for signals of potential direction.






Latest Goldman Sachs News





-
 Afghanistan
-
 Albania
-
 Algeria
-
 Angola
-
 Argentina
-
 Armenia
-
 Australia
-
 Austria
-
 Azerbaijan
-
 Bahamas
-
 Bahrain
-
 Bangladesh
-
 Belarus
-
 Belgium
-
 Bolivia
-
 Botswana
-
 Brazil
-
 Brunei
-
 Bulgaria
-
 Cambodia
-
 Cameroon
-
 Canada
-
 Chile
-
 China
-
 Colombia
-
 Congo
-
 Costa Rica
-
 Cote d'Ivoire
-
 Croatia
-
 Cuba
-
 Cyprus
-
 Czechia
-
 DR Congo
-
 Denmark
-
 Dominican Republic
-
 Ecuador
-
 Egypt
-
 El Salvador
-
 Estonia
-
 Eswatini
-
 Ethiopia
-
 Finland
-
 France
-
 Georgia
-
 Germany
-
 Ghana
-
 Greece
-
 Haiti
-
 Hong Kong
-
 Hungary
-
 India
-
 Indonesia
-
 Iran, Islamic republic
-
 Iraq
-
 Ireland
-
 Israel
-
 Italy
-
 Jamaica
-
 Japan
-
 Jordan
-
 Kazakhstan
-
 Kenya
-
 Korea
-
 Kuwait
-
 Kyrgyzstan
-
 Laos
-
 Latvia
-
 Lebanon
-
 Lesotho
-
 Libya
-
 Lithuania
-
 Luxembourg
-
 Madagascar
-
 Malaysia
-
 Malta
-
 Mauritius
-
 Mexico
-
 Moldova
-
 Mongolia
-
 Montenegro
-
 Morocco
-
 Mozambique
-
 Myanmar
-
 Namibia
-
 Nepal
-
 Netherlands
-
 New Zealand
-
 Nigeria
-
 North Macedonia
-
 Norway
-
 Oman
-
 Pakistan
-
 Palestine
-
 Panama
-
 Papua New Guinea
-
 Paraguay
-
 Peru
-
 Philippines
-
 Poland
-
 Portugal
-
 Puerto Rico
-
 Qatar
-
 Reunion
-
 Romania
-
 Rwanda
-
 Saudi Arabia
-
 Serbia
-
 Singapore
-
 Slovakia
-
 Slovenia
-
 Somalia
-
 South Africa
-
 Spain
-
 Sri Lanka
-
 Sweden
-
 Switzerland
-
 Syria
-
 Taiwan
-
 Tajikistan
-
 Tanzania
-
 Thailand
-
 Trinidad and Tobago
-
 Tunisia
-
 Turkey
-
 UAE
-
 Uganda
-
 Ukraine
-
 United Kingdom
-
United States
-
 Uruguay
-
 Uzbekistan
-
 Venezuela
-
 Vietnam
-
 Yemen
-
 Zambia
-
 Zimbabwe
- Forex
- Crypto












