

Will Goldman Sachs stock hold above $874.87 support as sellers keep control?

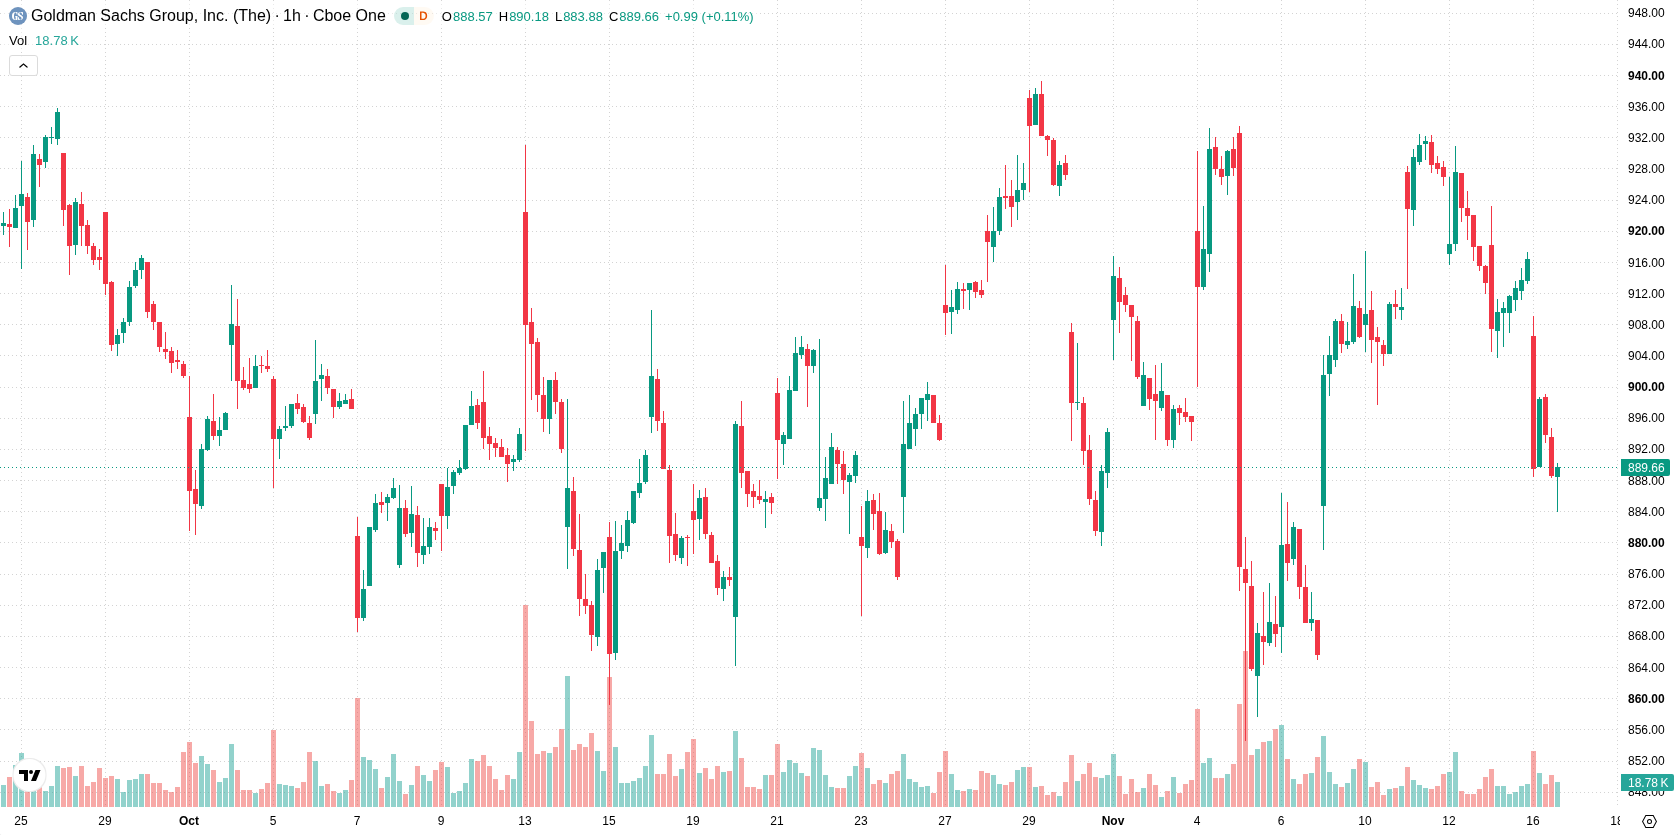
Goldman Sachs (GS) stock is trading at $890.33, down 2.82% on the day. The price sits below its key moving averages, pointing to sustained bearish momentum.
 905.54
932.40
Highlights
- Goldman Sachs pays a $20.00 annual dividend per share, offering a 2.2% yield with a 28.8% payout ratio.
- This capital return policy distributes a significant portion of earnings, supporting steady income for long-term shareholders.
- Shares of Goldman Sachs trade below key moving averages with the price at $890.33 and a 79% probability assigned to further downside within a $874.87 to $905.79 range.
Dividend stability attracts long-term holders despite persistent selloff
Goldman Sachs pays an annual dividend of $20.00 per share, reflecting a yield of 2.2% and a payout ratio of 28.8%, according to Defenseworld. This approach channels a substantial share of the firm’s earnings into direct distributions, offering a steady source of income for shareholders. The capital return policy is typically supportive for long-term investor participation, though price action has remained under broader selling pressure.
Seller dominance intensifies amid oversold signals and neutral indicators
On the technical front, GS is trading below the H1 SMA-20 at $918.42, H1 SMA-50 at $902.53, and the D1 SMA-200 at $955.79. Immediate resistance is highlighted by the Ichimoku Kijun at $916.03. Momentum indicators show neutral readings on the MACD and ADX, while the RSI is also neutral. The Stoch RSI and CCI are both in the oversold zone, signaling potential exhaustion among sellers. Bull/Bear Power shows a value of -6.07, indicating clear intraday dominance by sellers, with mixed momentum signals emerging from the oscillators.
Downside risk heightened as consolidation remains baseline scenario
Short-term scenarios place GS in a volatility band between $874.87 and $905.79 for the coming days. The probability of an upward move is estimated at 21%, with a 79% likelihood of continued downside, suggesting a recovery is less probable in the very near term. Baseline expectations are for the stock to consolidate sideways below resistance. A break above $916.03 could prompt a rebound toward the upper forecast range, while a downside break below $874.87 may expose the stock to further declines.
Earlier, analysts noted that Goldman Sachs was adjusting its Asian market forecasts to address ongoing uncertainties in global investment conditions, particularly regarding AI-related volatility. In light of the continued bearish momentum in Goldman Sachs shares, investors should monitor the $874.87 support level for potential downside risk in the near term.






Latest Goldman Sachs News




-
 Afghanistan
-
 Albania
-
 Algeria
-
 Angola
-
 Argentina
-
 Armenia
-
 Australia
-
 Austria
-
 Azerbaijan
-
 Bahamas
-
 Bahrain
-
 Bangladesh
-
 Belarus
-
 Belgium
-
 Bolivia
-
 Botswana
-
 Brazil
-
 Brunei
-
 Bulgaria
-
 Cambodia
-
 Cameroon
-
 Canada
-
 Chile
-
 China
-
 Colombia
-
 Congo
-
 Costa Rica
-
 Cote d'Ivoire
-
 Croatia
-
 Cuba
-
 Cyprus
-
 Czechia
-
 DR Congo
-
 Denmark
-
 Dominican Republic
-
 Ecuador
-
 Egypt
-
 El Salvador
-
 Estonia
-
 Eswatini
-
 Ethiopia
-
 Finland
-
 France
-
 Georgia
-
 Germany
-
 Ghana
-
 Greece
-
 Haiti
-
 Hong Kong
-
 Hungary
-
 India
-
 Indonesia
-
 Iran, Islamic republic
-
 Iraq
-
 Ireland
-
 Israel
-
 Italy
-
 Jamaica
-
 Japan
-
 Jordan
-
 Kazakhstan
-
 Kenya
-
 Korea
-
 Kuwait
-
 Kyrgyzstan
-
 Laos
-
 Latvia
-
 Lebanon
-
 Lesotho
-
 Libya
-
 Lithuania
-
 Luxembourg
-
 Madagascar
-
 Malaysia
-
 Malta
-
 Mauritius
-
 Mexico
-
 Moldova
-
 Mongolia
-
 Montenegro
-
 Morocco
-
 Mozambique
-
 Myanmar
-
 Namibia
-
 Nepal
-
 Netherlands
-
 New Zealand
-
 Nigeria
-
 North Macedonia
-
 Norway
-
 Oman
-
 Pakistan
-
 Palestine
-
 Panama
-
 Papua New Guinea
-
 Paraguay
-
 Peru
-
 Philippines
-
 Poland
-
 Portugal
-
 Puerto Rico
-
 Qatar
-
 Reunion
-
 Romania
-
 Rwanda
-
 Saudi Arabia
-
 Serbia
-
 Singapore
-
 Slovakia
-
 Slovenia
-
 Somalia
-
 South Africa
-
 Spain
-
 Sri Lanka
-
 Sweden
-
 Switzerland
-
 Syria
-
 Taiwan
-
 Tajikistan
-
 Tanzania
-
 Thailand
-
 Trinidad and Tobago
-
 Tunisia
-
 Turkey
-
 UAE
-
 Uganda
-
 Ukraine
-
 United Kingdom
-
United States
-
 Uruguay
-
 Uzbekistan
-
 Venezuela
-
 Vietnam
-
 Yemen
-
 Zambia
-
 Zimbabwe
- Forex
- Crypto












