

Goldman Sachs stock shows mixed chart signals amid recent nearly 7% advance: weekly analysis

Shares of Goldman Sachs Group, Inc. (GS) are trading near $922 after gaining nearly 7% over the past week, driven by a persistent recovery trend. While chart signals are divided — with oscillators flashing overbought and momentum readings tilting cautious — the setup points to a stretched position that could test the durability of recent gains heading into the new week.
 879.33
930.64
Highlights
- Shares of Goldman Sachs gained 6.5% over the past week to $921.82, now sitting at the upper end of the weekly range.
- The stock remains below its 200-day moving average, indicating a bearish long-term setup despite recent gains.
- Technical indicators warn of overbought conditions with mixed momentum, and prices are projected to consolidate between $891.67 and $951.96.
IPO underwriting and institutional buying shape sentiment despite looming liquidity risks
Goldman Sachs played a key role as lead underwriter in the ongoing Anthropic IPO, which could see the company's valuation surpass $1.5 trillion amid heightened investor enthusiasm, according to Benzinga. Regulatory filings also reveal that MKP Capital Management significantly increased its holdings in GS during the third quarter of 2026, suggesting institutional confidence in the bank's outlook. Elsewhere, Goldman Sachs' strong dividend policy and recent insider selling continue to draw attention as the market reassesses the stock's performance and risk factors for the days ahead. Additionally, a Goldman Sachs research note has highlighted the risk of a potential U.S. market liquidity crisis in 2027, an undercurrent that may inform sentiment this week.
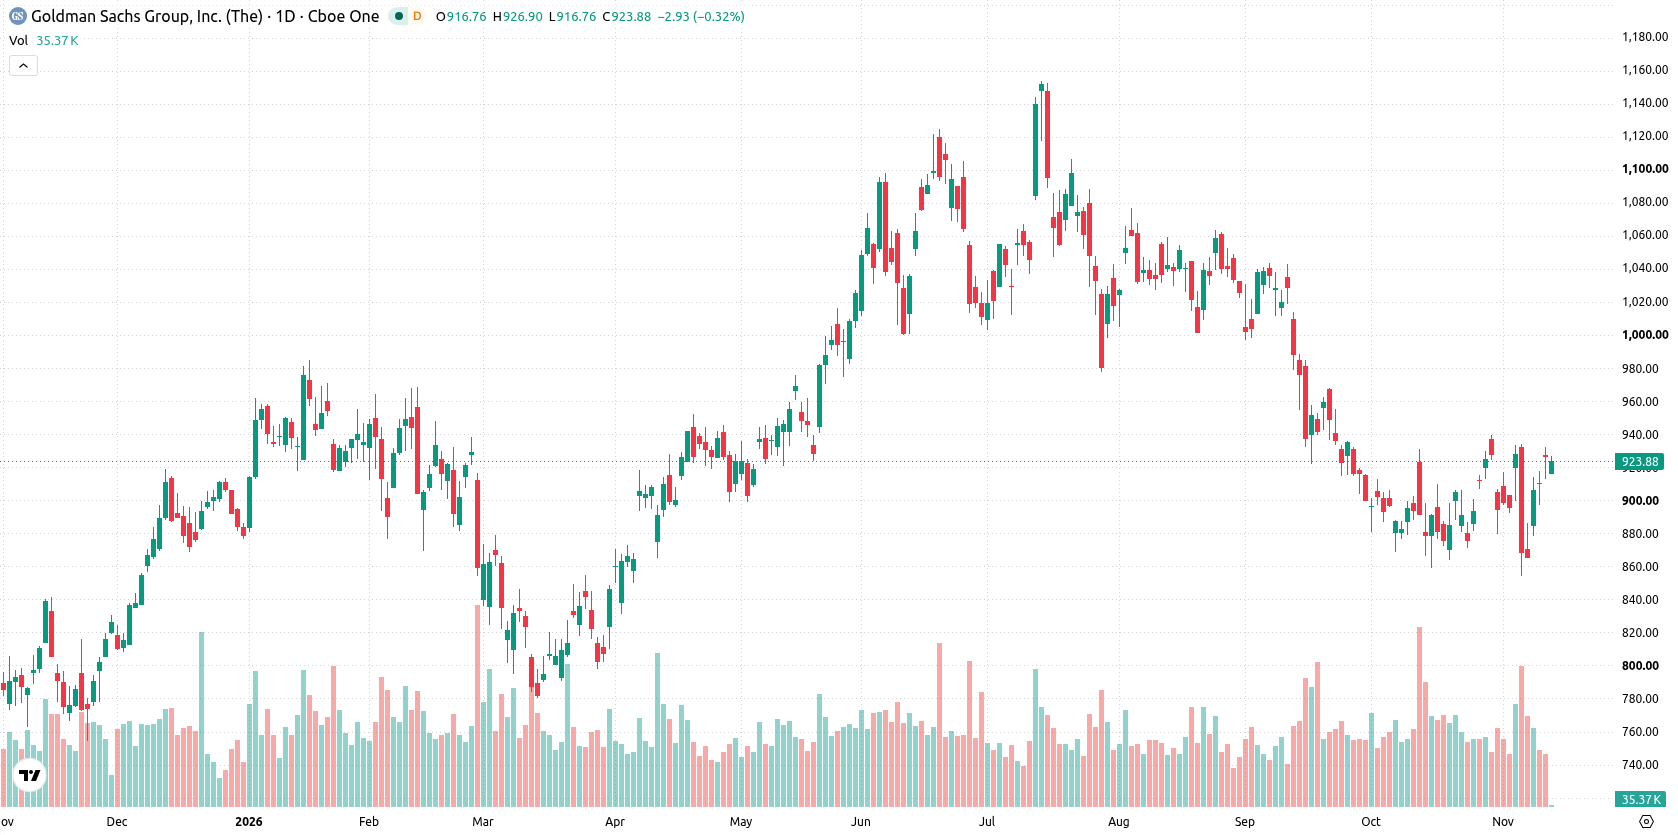
Overbought signals intensify as rangebound action heightens risk of correction
On the daily chart, the setup reflects a contained move within a narrow range as volatility over the past week measured 7.79%. The main signals are mixed: the CCI and Stochastic RSI are overbought, suggesting the stock may be overheating, while the RSI remains neutral at 54.82. The MACD issues a strong sell reading, even as Bull/Bear Power leans overbought, indicating possible risk of downside correction. Support rests at the $897.89 MA-20 and Ichimoku Kijun ($897.14), with resistance found at the $926.09 MA-50.
Neutral outlook for next week as consolidation likely inside key boundaries
For the coming trading week, shares are expected to fluctuate between $891.67 and $951.96. The probability of an increase stands at 52%, while a decrease is at 48%. The base case calls for consolidation inside this band, with directionally neutral price action. A decisive break above the $926.09 resistance could open a move toward the upper end of the range, while a drop below the $897.89 support would signal a shift in momentum and a likely test of the lower boundary.
Earlier, analysts noted that Goldman Sachs exhibited mixed technical momentum amid continued institutional repositioning and new leadership appointments, leading to a cautiously neutral outlook. The current analysis adds a significant catalyst from the Anthropic IPO and fresh institutional buying, but with overbought signals persisting, traders should focus on the $926.09 resistance as a critical inflection point for further price action.






Latest Goldman Sachs News




-
 Afghanistan
-
 Albania
-
 Algeria
-
 Angola
-
 Argentina
-
 Armenia
-
 Australia
-
 Austria
-
 Azerbaijan
-
 Bahamas
-
 Bahrain
-
 Bangladesh
-
 Belarus
-
 Belgium
-
 Bolivia
-
 Botswana
-
 Brazil
-
 Brunei
-
 Bulgaria
-
 Cambodia
-
 Cameroon
-
 Canada
-
 Chile
-
 China
-
 Colombia
-
 Congo
-
 Costa Rica
-
 Cote d'Ivoire
-
 Croatia
-
 Cuba
-
 Cyprus
-
 Czechia
-
 DR Congo
-
 Denmark
-
 Dominican Republic
-
 Ecuador
-
 Egypt
-
 El Salvador
-
 Estonia
-
 Eswatini
-
 Ethiopia
-
 Finland
-
 France
-
 Georgia
-
 Germany
-
 Ghana
-
 Greece
-
 Haiti
-
 Hong Kong
-
 Hungary
-
 India
-
 Indonesia
-
 Iran, Islamic republic
-
 Iraq
-
 Ireland
-
 Israel
-
 Italy
-
 Jamaica
-
 Japan
-
 Jordan
-
 Kazakhstan
-
 Kenya
-
 Korea
-
 Kuwait
-
 Kyrgyzstan
-
 Laos
-
 Latvia
-
 Lebanon
-
 Lesotho
-
 Libya
-
 Lithuania
-
 Luxembourg
-
 Madagascar
-
 Malaysia
-
 Malta
-
 Mauritius
-
 Mexico
-
 Moldova
-
 Mongolia
-
 Montenegro
-
 Morocco
-
 Mozambique
-
 Myanmar
-
 Namibia
-
 Nepal
-
 Netherlands
-
 New Zealand
-
 Nigeria
-
 North Macedonia
-
 Norway
-
 Oman
-
 Pakistan
-
 Palestine
-
 Panama
-
 Papua New Guinea
-
 Paraguay
-
 Peru
-
 Philippines
-
 Poland
-
 Portugal
-
 Puerto Rico
-
 Qatar
-
 Reunion
-
 Romania
-
 Rwanda
-
 Saudi Arabia
-
 Serbia
-
 Singapore
-
 Slovakia
-
 Slovenia
-
 Somalia
-
 South Africa
-
 Spain
-
 Sri Lanka
-
 Sweden
-
 Switzerland
-
 Syria
-
 Taiwan
-
 Tajikistan
-
 Tanzania
-
 Thailand
-
 Trinidad and Tobago
-
 Tunisia
-
 Turkey
-
 UAE
-
 Uganda
-
 Ukraine
-
 United Kingdom
-
United States
-
 Uruguay
-
 Uzbekistan
-
 Venezuela
-
 Vietnam
-
 Yemen
-
 Zambia
-
 Zimbabwe
- Forex
- Crypto












