

Goldman Sachs stock outlook: Downside risk elevated as seller pressure persists

Goldman Sachs (GS) stock is trading at $809.06, down 4.54% on the day. The price sits below its key short- and long-term moving averages, suggesting continued downward momentum.
 826.67
908.99
Highlights
- ETFs added $64.6 million of Goldman Sachs stock on November 17, 2026, temporarily increasing share liquidity via passive inflows.
- Goldman Sachs led a $280 million investment round in Payhawk to expand its global finance platform, increasing fintech exposure.
- Goldman Sachs stock trades below major moving averages with strong bearish momentum and is forecast to range between $779.95 and $838.17.
Market outflows outweigh ETF inflows despite fintech investment activity
On November 17, 2026, ETFs collectively purchased $64.6 million of Goldman Sachs stock, a passive inflow that can temporarily support share liquidity, according to Gurufocus. While such flows typically cushion downside risk, they were not sufficient to offset broader market selling pressure. Separately, Goldman Sachs led a $280 million funding round for Payhawk to advance its global Finance Operating System, reflecting the firm's continued alignment with fintech innovation, as reported by Yahoo Finance. Both developments offer longer-term strategic value, though price action has remained under broader selling pressure.
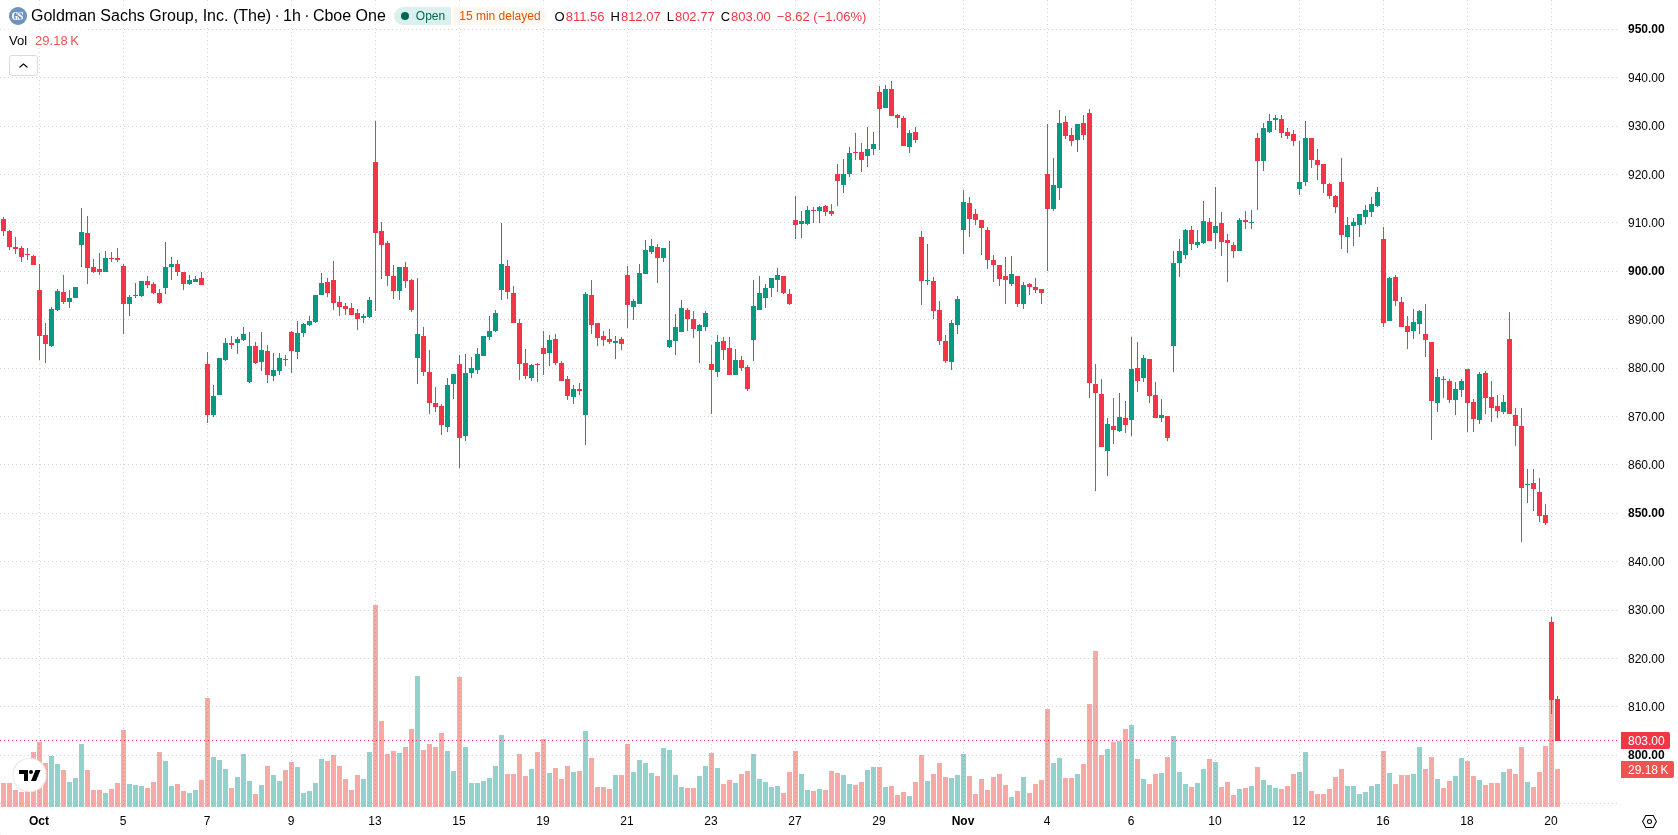
Bearish momentum sustains as oversold signals fail to trigger rebound
GS is positioned below all current moving averages: the H1 SMA-20 at $865.73, H1 SMA-50 at $892.63, and D1 SMA-200 at $954.6. The nearest resistance is marked by the Ichimoku Kijun at $853.9. MACD and ADX confirm ongoing bearish momentum. RSI, Stoch RSI, and CCI are each in oversold territory, indicating selling exhaustion but without a reversal. Bull/Bear Power is negative at -29.69, displaying intraday seller dominance, while the Awesome Oscillator supports the persistent selloff.
Downside favored as volatility limits upside breakout opportunity
GS is forecast to trade between $779.95 and $838.17 over the upcoming sessions, reflecting a typical volatility band relative to current levels. The probability of an upside move remains very low, with downside continuation considered highly probable. A baseline scenario anticipates range-bound consolidation within this interval, whereas any bullish setup would first require a breakout above the $853.9 resistance. A decisive breakdown below $779.95 would confirm another bearish leg.
Previously it was reported that sustained institutional selling and persistent negative technical signals pointed to a prevailing bearish trend for Goldman Sachs shares. The current analysis reinforces this downside outlook, with ongoing price weakness and oversold conditions highlighting the importance of monitoring the $779.95 level for a potential breakdown or further bearish continuation.










-
 Afghanistan
-
 Albania
-
 Algeria
-
 Angola
-
 Argentina
-
 Armenia
-
 Australia
-
 Austria
-
 Azerbaijan
-
 Bahamas
-
 Bahrain
-
 Bangladesh
-
 Belarus
-
 Belgium
-
 Bolivia
-
 Botswana
-
 Brazil
-
 Brunei
-
 Bulgaria
-
 Cambodia
-
 Cameroon
-
 Canada
-
 Chile
-
 China
-
 Colombia
-
 Congo
-
 Costa Rica
-
 Cote d'Ivoire
-
 Croatia
-
 Cuba
-
 Cyprus
-
 Czechia
-
 DR Congo
-
 Denmark
-
 Dominican Republic
-
 Ecuador
-
 Egypt
-
 El Salvador
-
 Estonia
-
 Eswatini
-
 Ethiopia
-
 Finland
-
 France
-
 Georgia
-
 Germany
-
 Ghana
-
 Greece
-
 Haiti
-
 Hong Kong
-
 Hungary
-
 India
-
 Indonesia
-
 Iran, Islamic republic
-
 Iraq
-
 Ireland
-
 Israel
-
 Italy
-
 Jamaica
-
 Japan
-
 Jordan
-
 Kazakhstan
-
 Kenya
-
 Korea
-
 Kuwait
-
 Kyrgyzstan
-
 Laos
-
 Latvia
-
 Lebanon
-
 Lesotho
-
 Libya
-
 Lithuania
-
 Luxembourg
-
 Madagascar
-
 Malaysia
-
 Malta
-
 Mauritius
-
 Mexico
-
 Moldova
-
 Mongolia
-
 Montenegro
-
 Morocco
-
 Mozambique
-
 Myanmar
-
 Namibia
-
 Nepal
-
 Netherlands
-
 New Zealand
-
 Nigeria
-
 North Macedonia
-
 Norway
-
 Oman
-
 Pakistan
-
 Palestine
-
 Panama
-
 Papua New Guinea
-
 Paraguay
-
 Peru
-
 Philippines
-
 Poland
-
 Portugal
-
 Puerto Rico
-
 Qatar
-
 Reunion
-
 Romania
-
 Rwanda
-
 Saudi Arabia
-
 Serbia
-
 Singapore
-
 Slovakia
-
 Slovenia
-
 Somalia
-
 South Africa
-
 Spain
-
 Sri Lanka
-
 Sweden
-
 Switzerland
-
 Syria
-
 Taiwan
-
 Tajikistan
-
 Tanzania
-
 Thailand
-
 Trinidad and Tobago
-
 Tunisia
-
 Turkey
-
 UAE
-
 Uganda
-
 Ukraine
-
 United Kingdom
-
United States
-
 Uruguay
-
 Uzbekistan
-
 Venezuela
-
 Vietnam
-
 Yemen
-
 Zambia
-
 Zimbabwe
- Forex
- Crypto












