

Goldman Sachs stock selloff deepens as AI earnings growth depends on limited buyers

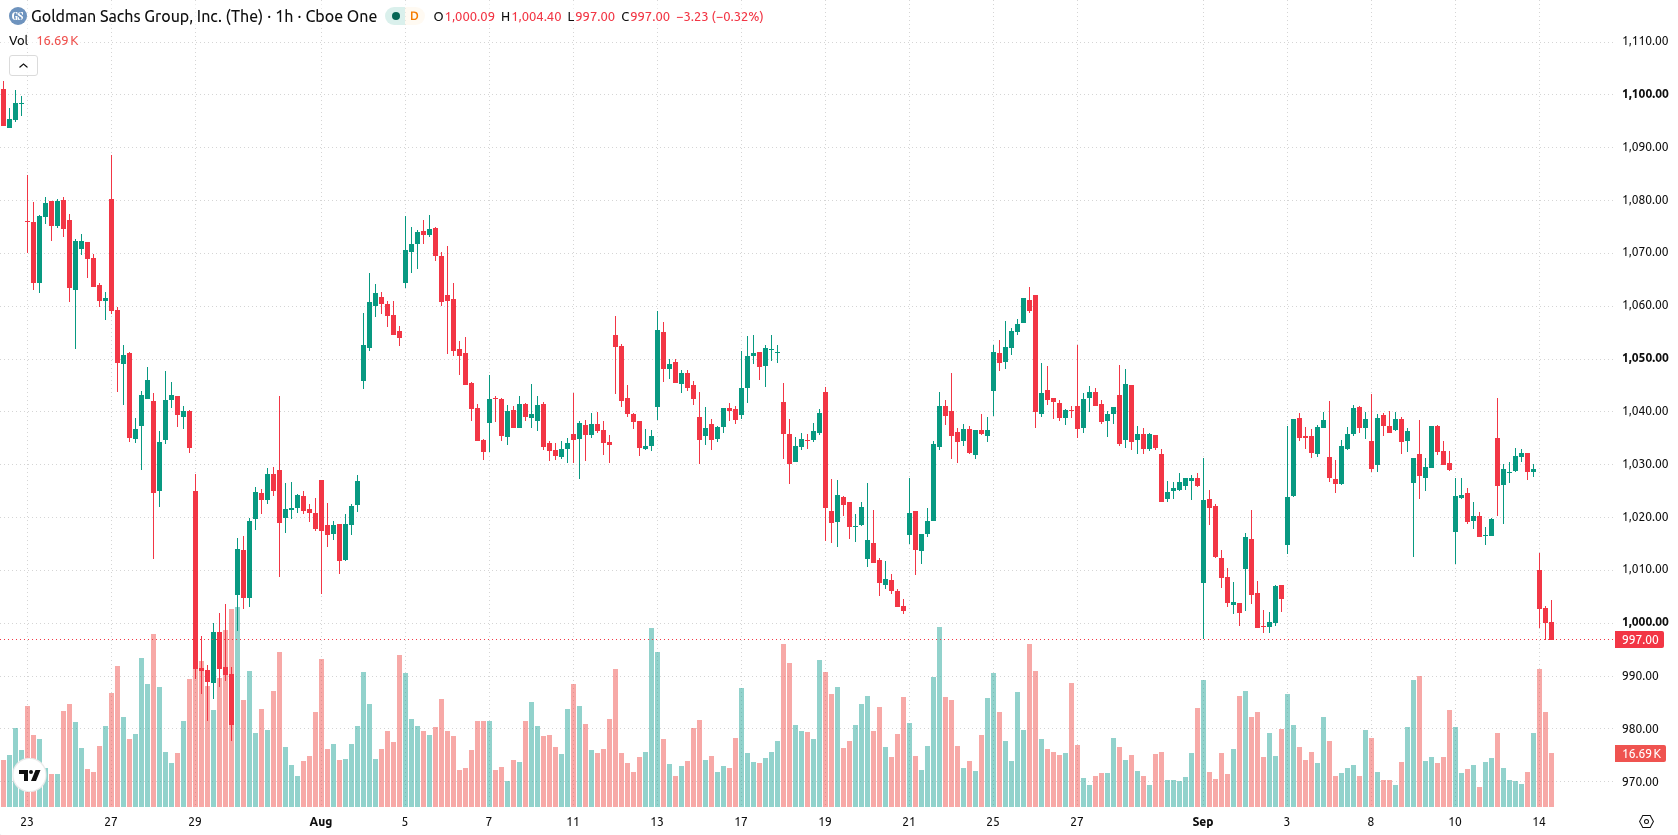
Goldman Sachs (GS) stock is trading at $997.1, down 3.1% for the day, after opening with a gap lower. The stock currently sits below its key short- and medium-term moving averages but remains supported by its longer-term daily average.
 904.11
939.28
Highlights
- Goldman Sachs estimates that spending tied to artificial intelligence accounts for roughly half of current S&P 500 earnings growth.
- The earnings outlook is exposed to risk because gains depend on a narrow group of major purchasers.
- GS/USD faces persistent short- and medium-term selling pressure below key moving averages, with a projected range of $985.85 to $1,009 and a higher probability of downward movement in coming sessions.
Earnings growth powered by AI spending as buyer concentration raises risk
Goldman Sachs has acknowledged that artificial intelligence-related spending is responsible for about half of current earnings growth in the S&P 500, according to 247wallst. The firm also cautioned that this performance relies heavily on a small group of major buyers, exposing a potential vulnerability in the earnings backdrop. This combination of tailwind and concentration risk highlights structural sensitivity in the firm's outlook.
Resistance strengthens as momentum signals diverge and buyers face limits
On the technical front, GS trades below both the MA-20 and MA-50 on the hourly chart but holds above the daily MA-200. The Ichimoku Kijun stands at $1,027 and serves as immediate resistance. Indicator signals are mixed: MACD and ADX remain neutral, RSI shows a Buy signal, while Stoch RSI, CCI, and MACD also register as neutral. Bull/Bear Power is in overbought territory, indicating recent buyer dominance despite the overall neutral-to-bearish bias from the other oscillators.
Rangebound trading likely as upward momentum stalls below resistance
In the short term, GS is expected to remain rangebound, with a probable trading corridor between $985.85 and $1,009. The likelihood of a significant upward move is low, and a downside break below $985.85 would suggest stronger bearish momentum. Any move above the $1,027 resistance would open the way for a more bullish scenario within the near-term volatility band.
Earlier, analysts noted that Goldman Sachs shares were in a period of consolidation, with mixed technical signals and uncertainty surrounding the next directional move. The current analysis adds to this by highlighting ongoing neutral-to-bearish pressure and the importance of watching for a clear breakout above $1,027 or a downside move below $985.85 as potential catalysts for the next significant trend.






Latest Goldman Sachs News



-
 Afghanistan
-
 Albania
-
 Algeria
-
 Angola
-
 Argentina
-
 Armenia
-
 Australia
-
 Austria
-
 Azerbaijan
-
 Bahamas
-
 Bahrain
-
 Bangladesh
-
 Belarus
-
 Belgium
-
 Bolivia
-
 Botswana
-
 Brazil
-
 Brunei
-
 Bulgaria
-
 Cambodia
-
 Cameroon
-
 Canada
-
 Chile
-
 China
-
 Colombia
-
 Congo
-
 Costa Rica
-
 Cote d'Ivoire
-
 Croatia
-
 Cuba
-
 Cyprus
-
 Czechia
-
 DR Congo
-
 Denmark
-
 Dominican Republic
-
 Ecuador
-
 Egypt
-
 El Salvador
-
 Estonia
-
 Eswatini
-
 Ethiopia
-
 Finland
-
 France
-
 Georgia
-
 Germany
-
 Ghana
-
 Greece
-
 Haiti
-
 Hong Kong
-
 Hungary
-
 India
-
 Indonesia
-
 Iran, Islamic republic
-
 Iraq
-
 Ireland
-
 Israel
-
 Italy
-
 Jamaica
-
 Japan
-
 Jordan
-
 Kazakhstan
-
 Kenya
-
 Korea
-
 Kuwait
-
 Kyrgyzstan
-
 Laos
-
 Latvia
-
 Lebanon
-
 Lesotho
-
 Libya
-
 Lithuania
-
 Luxembourg
-
 Madagascar
-
 Malaysia
-
 Malta
-
 Mauritius
-
 Mexico
-
 Moldova
-
 Mongolia
-
 Montenegro
-
 Morocco
-
 Mozambique
-
 Myanmar
-
 Namibia
-
 Nepal
-
 Netherlands
-
 New Zealand
-
 Nigeria
-
 North Macedonia
-
 Norway
-
 Oman
-
 Pakistan
-
 Palestine
-
 Panama
-
 Papua New Guinea
-
 Paraguay
-
 Peru
-
 Philippines
-
 Poland
-
 Portugal
-
 Puerto Rico
-
 Qatar
-
 Reunion
-
 Romania
-
 Rwanda
-
 Saudi Arabia
-
 Serbia
-
 Singapore
-
 Slovakia
-
 Slovenia
-
 Somalia
-
 South Africa
-
 Spain
-
 Sri Lanka
-
 Sweden
-
 Switzerland
-
 Syria
-
 Taiwan
-
 Tajikistan
-
 Tanzania
-
 Thailand
-
 Trinidad and Tobago
-
 Tunisia
-
 Turkey
-
 UAE
-
 Uganda
-
 Ukraine
-
 United Kingdom
-
United States
-
 Uruguay
-
 Uzbekistan
-
 Venezuela
-
 Vietnam
-
 Yemen
-
 Zambia
-
 Zimbabwe
- Forex
- Crypto












