

Goldman Sachs stock holds below MA-20 and MA-50 with mixed technical signals: weekly analysis

Shares of Goldman Sachs Group, Inc. (GS) are trading near $1,001 after a sizable drop of around 2.5% over the past week. Chart signals remain mixed, with buyers struggling to regain control as short-term weakness persists. This conflict between technical caution and pockets of strength sets the tone as the new week begins.
 904.11
939.28
Highlights
- Shares of Goldman Sachs fell 2.56% over the past week and now trade below key short-term moving averages.
- Short-term indicators show a bearish structure with neutral oscillators and the MACD in clear sell territory.
- The stock is expected to consolidate between $981.15 and $1,012, with support at $953.11 and resistance at $1,014.
Robust earnings lift sentiment even as capital ratios and AI spending raise caution
Goldman Sachs posted a strong second-quarter 2026 earnings report, with investment banking fees jumping 48% year-over-year to $2.84 billion, mainly on robust M&A advisory and strategic transactions, according to Alphastreet. The firm's annualized return on equity reached 23.5%, well above its historical range, reflecting effective capital management and solid fixed-income trading. However, the CET1 ratio fell to 12.5% on increased risk-weighted assets and capital returns, while management noted that higher AI spending is supporting S&P 500 earnings, as reported by 24/7 Wall St.
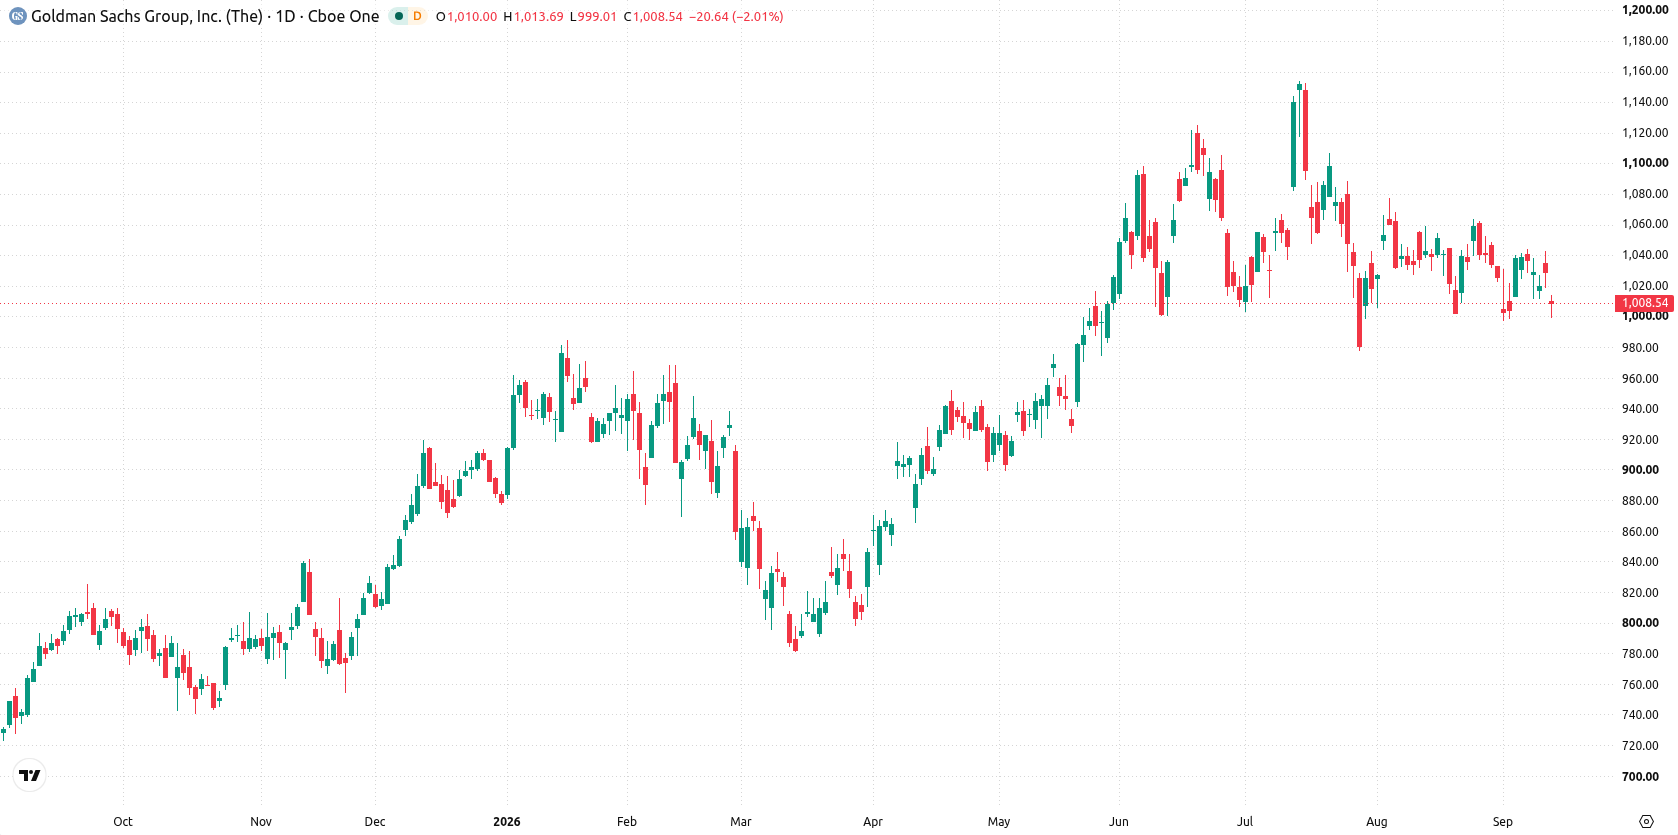
Price stays weak below key averages as MACD signals downside over the week
On the daily chart, Goldman Sachs displays a contained move within a narrow range, with volatility over the past week at 2.48%. The price is currently below the MA-20 ($1,031) and the MA-50 ($1,044), both signaling short-term weakness, while the MACD remains firmly in sell territory at -4.88. Oscillators such as RSI (48.7) and CCI (-18.35) hold in neutral zones, so directional conviction is limited, but with Bull/Bear Power at 8.5 showing overbought conditions, a further down move cannot be ruled out. Nearest resistance stands at $1,014, with the Ichimoku Kijun at $1,033 also acting as resistance, while support is found at $953.11 from the 200-day moving average.
Directional bias remains neutral as consolidation and breakout risks persist
Over the coming trading week, the expected range for Goldman Sachs is $981.15 to $1,012, with a 50% probability of either an increase or a decrease. The base case is continued price consolidation inside this range, given flat trend strength and mixed signals. A move above $1,014 would set up a potential rebound toward higher resistance near the Ichimoku Kijun. Conversely, if shares fall below support at $953.11, a deeper short-term setback becomes likely.
Earlier, analysts noted that shifting Federal Reserve policy expectations had become a key driver for Goldman Sachs’ outlook. With the stock consolidating below key resistance and volatility persisting, traders should monitor whether a sustained break above $1,014 or below $953.11 defines the next directional move.






Latest Goldman Sachs News




-
 Afghanistan
-
 Albania
-
 Algeria
-
 Angola
-
 Argentina
-
 Armenia
-
 Australia
-
 Austria
-
 Azerbaijan
-
 Bahamas
-
 Bahrain
-
 Bangladesh
-
 Belarus
-
 Belgium
-
 Bolivia
-
 Botswana
-
 Brazil
-
 Brunei
-
 Bulgaria
-
 Cambodia
-
 Cameroon
-
 Canada
-
 Chile
-
 China
-
 Colombia
-
 Congo
-
 Costa Rica
-
 Cote d'Ivoire
-
 Croatia
-
 Cuba
-
 Cyprus
-
 Czechia
-
 DR Congo
-
 Denmark
-
 Dominican Republic
-
 Ecuador
-
 Egypt
-
 El Salvador
-
 Estonia
-
 Eswatini
-
 Ethiopia
-
 Finland
-
 France
-
 Georgia
-
 Germany
-
 Ghana
-
 Greece
-
 Haiti
-
 Hong Kong
-
 Hungary
-
 India
-
 Indonesia
-
 Iran, Islamic republic
-
 Iraq
-
 Ireland
-
 Israel
-
 Italy
-
 Jamaica
-
 Japan
-
 Jordan
-
 Kazakhstan
-
 Kenya
-
 Korea
-
 Kuwait
-
 Kyrgyzstan
-
 Laos
-
 Latvia
-
 Lebanon
-
 Lesotho
-
 Libya
-
 Lithuania
-
 Luxembourg
-
 Madagascar
-
 Malaysia
-
 Malta
-
 Mauritius
-
 Mexico
-
 Moldova
-
 Mongolia
-
 Montenegro
-
 Morocco
-
 Mozambique
-
 Myanmar
-
 Namibia
-
 Nepal
-
 Netherlands
-
 New Zealand
-
 Nigeria
-
 North Macedonia
-
 Norway
-
 Oman
-
 Pakistan
-
 Palestine
-
 Panama
-
 Papua New Guinea
-
 Paraguay
-
 Peru
-
 Philippines
-
 Poland
-
 Portugal
-
 Puerto Rico
-
 Qatar
-
 Reunion
-
 Romania
-
 Rwanda
-
 Saudi Arabia
-
 Serbia
-
 Singapore
-
 Slovakia
-
 Slovenia
-
 Somalia
-
 South Africa
-
 Spain
-
 Sri Lanka
-
 Sweden
-
 Switzerland
-
 Syria
-
 Taiwan
-
 Tajikistan
-
 Tanzania
-
 Thailand
-
 Trinidad and Tobago
-
 Tunisia
-
 Turkey
-
 UAE
-
 Uganda
-
 Ukraine
-
 United Kingdom
-
United States
-
 Uruguay
-
 Uzbekistan
-
 Venezuela
-
 Vietnam
-
 Yemen
-
 Zambia
-
 Zimbabwe
- Forex
- Crypto












