

Can Arm stock break resistance after record revenue beats estimates?

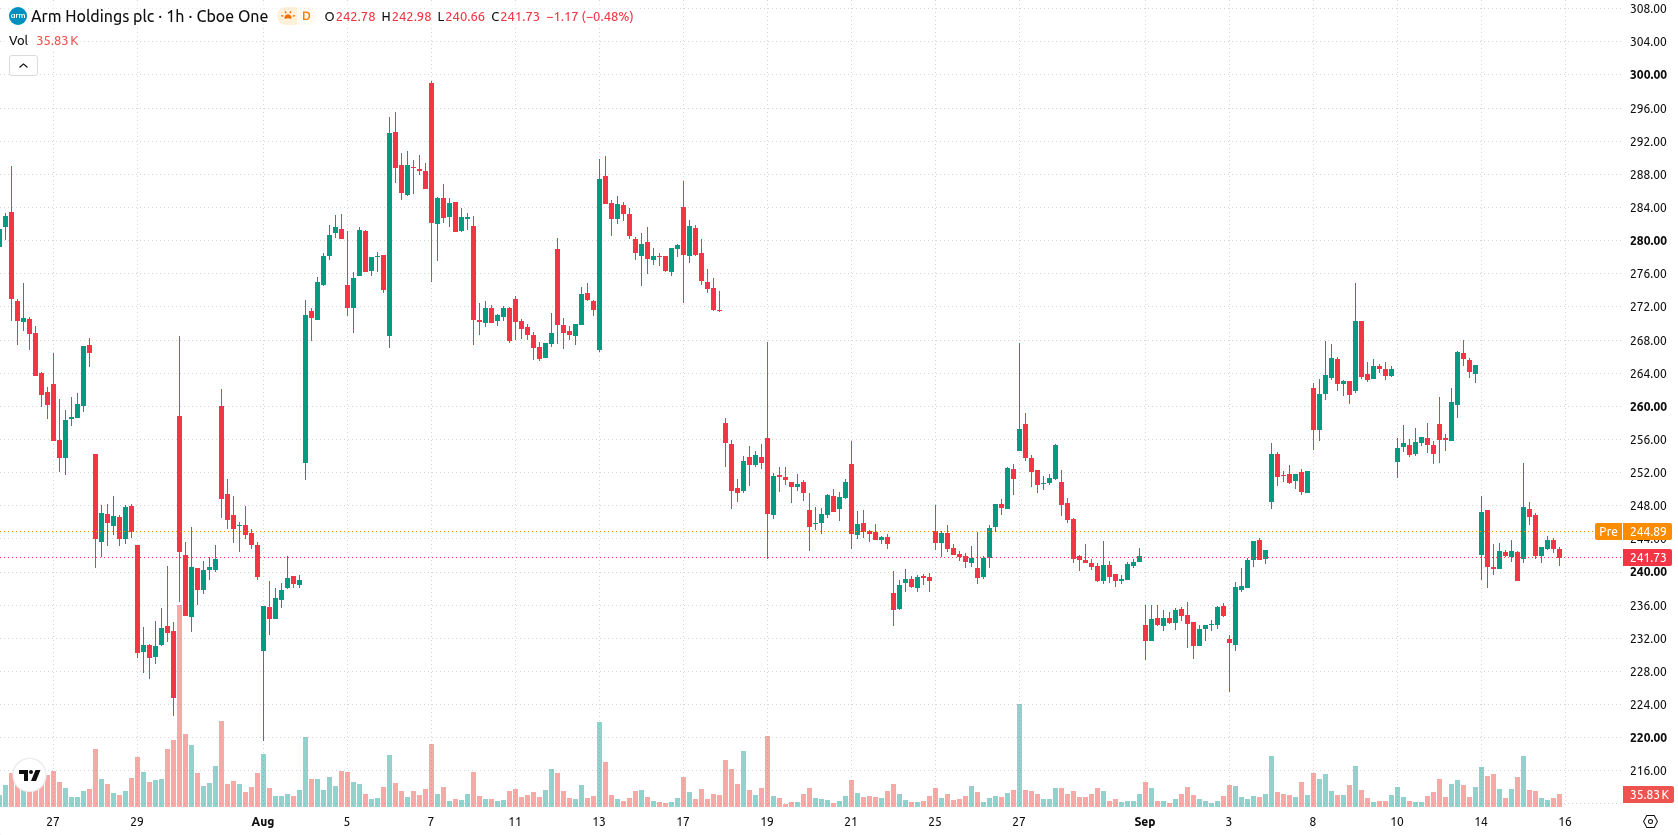
Arm (ARM) stock is trading at $241.83 after gaining 1.18% on the day. The price remains below its key moving averages, while holding above longer-term support levels.
 184.56
207.31
Highlights
- Arm reported fiscal first quarter 2027 revenue up 22% year over year to $1.29 billion, reaching a new record.
- Royalty and licensing revenue each increased more than 20%, with non-GAAP earnings per share at $0.45 and exceeding expectations.
- Shares of Arm trade below key short- and medium-term averages with most technical indicators showing strong selling momentum and a projected range of $225.5 to $258.16 for upcoming sessions.
Record revenue growth and earnings fuel investor optimism
Arm posted a 22% year-over-year revenue increase to $1.29 billion in its fiscal first quarter of 2027, reaching a new first-quarter record and signaling robust top-line momentum in its core markets. Strong royalty and licensing gains, up 22% and 23% respectively, highlight increased customer adoption and expanding deployment of Arm technology solutions. Non-GAAP earnings per share also exceeded expectations at $0.45, according to Aol, reinforcing the positive earnings trajectory and driving renewed investor interest.
Bearish momentum persists despite oversold signals and volatility
The $241.83 price level currently sits below the MA-20 at $249.2 and MA-50 at $254.43 on the hourly timeframe, while holding above the daily MA-200 at $205.38. Immediate resistance is defined by the Ichimoku Kijun at $252.97, with nearby technical resistance reinforced in this zone. Key support remains at $225.5. MACD points to a Sell signal, ADX stays Neutral, and both RSI at 39.59 and CCI signal oversold momentum on the Sell side. Stochastic RSI offers a potential Buy signal, while Bull/Bear Power and the Awesome Oscillator both align with selling momentum, indicating sellers still dominate on an intraday basis amid notable volatility.
Sideways outlook favored as resistance caps bullish potential
In the short term, ARM is expected to trade within a volatility band ranging from $225.5 to $258.16. The baseline scenario projects continued sideways movement within this corridor as intraday conditions remain fragile. A bullish breakout would require a close above the $252.97 resistance, potentially triggering further gains, while a break below $225.5 would likely accelerate downside momentum over the coming sessions. The probability of a sustained upward move remains low in the current technical environment.
Earlier, analysts noted that Arm faced ongoing valuation concerns and technical weakness, despite solid long-term fundamentals and growth in its royalty streams. The current analysis adds that, while positive earnings and revenue momentum have been reported, traders should closely monitor the $252.97 resistance for confirmation of any meaningful upside shift in the prevailing sideways price action.










-
 Afghanistan
-
 Albania
-
 Algeria
-
 Angola
-
 Argentina
-
 Armenia
-
 Australia
-
 Austria
-
 Azerbaijan
-
 Bahamas
-
 Bahrain
-
 Bangladesh
-
 Belarus
-
 Belgium
-
 Bolivia
-
 Botswana
-
 Brazil
-
 Brunei
-
 Bulgaria
-
 Cambodia
-
 Cameroon
-
 Canada
-
 Chile
-
 China
-
 Colombia
-
 Congo
-
 Costa Rica
-
 Cote d'Ivoire
-
 Croatia
-
 Cuba
-
 Cyprus
-
 Czechia
-
 DR Congo
-
 Denmark
-
 Dominican Republic
-
 Ecuador
-
 Egypt
-
 El Salvador
-
 Estonia
-
 Eswatini
-
 Ethiopia
-
 Finland
-
 France
-
 Georgia
-
 Germany
-
 Ghana
-
 Greece
-
 Haiti
-
 Hong Kong
-
 Hungary
-
 India
-
 Indonesia
-
 Iran, Islamic republic
-
 Iraq
-
 Ireland
-
 Israel
-
 Italy
-
 Jamaica
-
 Japan
-
 Jordan
-
 Kazakhstan
-
 Kenya
-
 Korea
-
 Kuwait
-
 Kyrgyzstan
-
 Laos
-
 Latvia
-
 Lebanon
-
 Lesotho
-
 Libya
-
 Lithuania
-
 Luxembourg
-
 Madagascar
-
 Malaysia
-
 Malta
-
 Mauritius
-
 Mexico
-
 Moldova
-
 Mongolia
-
 Montenegro
-
 Morocco
-
 Mozambique
-
 Myanmar
-
 Namibia
-
 Nepal
-
 Netherlands
-
 New Zealand
-
 Nigeria
-
 North Macedonia
-
 Norway
-
 Oman
-
 Pakistan
-
 Palestine
-
 Panama
-
 Papua New Guinea
-
 Paraguay
-
 Peru
-
 Philippines
-
 Poland
-
 Portugal
-
 Puerto Rico
-
 Qatar
-
 Reunion
-
 Romania
-
 Rwanda
-
 Saudi Arabia
-
 Serbia
-
 Singapore
-
 Slovakia
-
 Slovenia
-
 Somalia
-
 South Africa
-
 Spain
-
 Sri Lanka
-
 Sweden
-
 Switzerland
-
 Syria
-
 Taiwan
-
 Tajikistan
-
 Tanzania
-
 Thailand
-
 Trinidad and Tobago
-
 Tunisia
-
 Turkey
-
 UAE
-
 Uganda
-
 Ukraine
-
 United Kingdom
-
United States
-
 Uruguay
-
 Uzbekistan
-
 Venezuela
-
 Vietnam
-
 Yemen
-
 Zambia
-
 Zimbabwe
- Forex
- Crypto












