

Mastercard shares consolidate amid cautious bullish signals and modest volatility: weekly analysis

Shares of Mastercard Inc (MA) are trading near $571, consolidating in the middle of their recent range with technicals showing mixed momentum. Although volatility has stayed modest, chart signals conflict as the stock stretches toward oversold territory. The coming week will hinge on whether nascent bullish signals firm or buyers remain cautious.
 639.98
Highlights
- Shares of Mastercard edged $2.13 higher over the past week, trading at $571.37 and consolidating between key moving averages.
- Technical indicators show a bullish long-term trend and a strong buy signal, but daily momentum remains unconfirmed with neutral positioning.
- The stock is expected to trade between $564.51 and $584.7 over the next five days, with resistance at $578.19 and support at $563.75.
Earnings beat and strategic launches drive optimism amid expansion push
Mastercard has launched Wallet Pay, a new service interlinking digital wallets across contactless, QR, and online payments globally, according to Simply Wall St News. Yahoo Finance reported on September 7, 2026, that the company partnered with Flowcart to enable secure card payments inside social messaging, beginning in Kenya and aiming to expand into East and West Africa. Mastercard also reported a strong Q2 2026 earnings beat with 14.1% revenue growth and a 46.34% net margin, and introduced new AI-driven payment tools for merchants while reaffirming ongoing buybacks and dividends at the Goldman Sachs Communacopia + Technology conference.
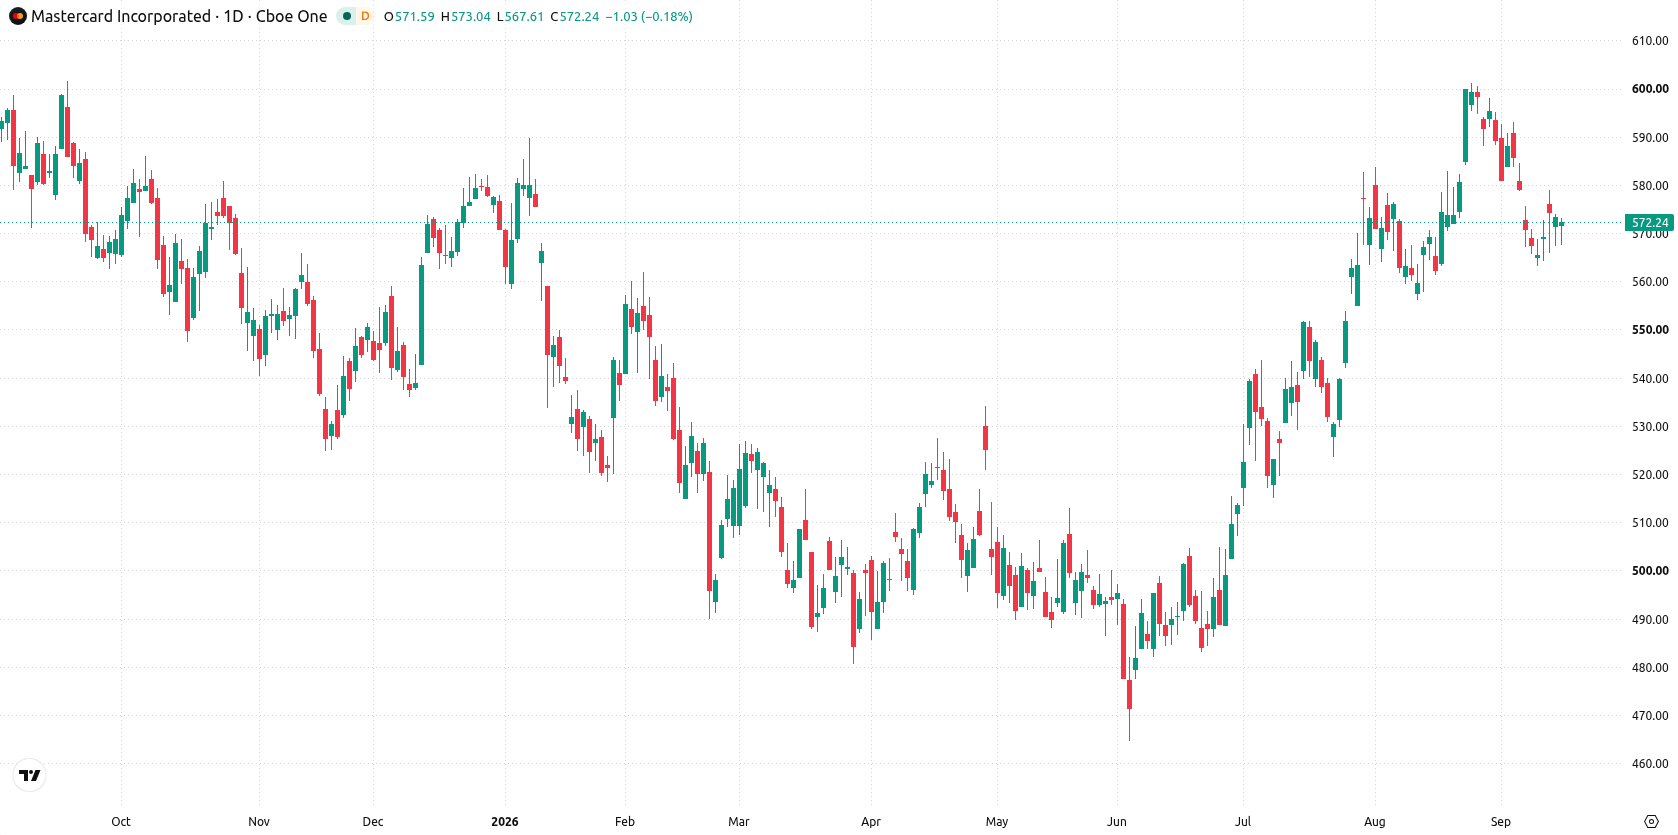
MACD buy signal and neutral RSI shape indecisive weekly consolidation
On the daily chart, price action is consolidating between levels, with volatility over the past week at 2.72%. The MACD points to a strong buy with a value of 0.9, while the RSI sits in the neutral zone at 49.86, showing a lack of clear directional conviction. Momentum character points to an emerging move higher that is not yet confirmed. Immediate support is found at $563.75, with resistance set by the Ichimoku Kijun at $578.19, keeping the stock near the center of its recent range.
Rangebound scenario favored barring breakout above resistance in the coming week
Over the next five trading days, Mastercard is expected to trade between $564.51 and $584.7. The probability of an increase stands at 63%, while the chance of a decrease is 37%. The base case calls for continued range trading between $563.75 and $578.19. A break above $578.19 would open the way for further gains toward the top of the expected range, while a push below $563.75 may usher in downside risk toward $564.51.
Earlier, analysts noted that Mastercard shares were facing mixed technical signals amid a consolidating range and highlighted key levels as pivotal for near-term direction. The latest developments, including strong earnings and new digital product initiatives, add a fresh dimension for traders, who should monitor $578.19 as an immediate resistance level that could set the tone for further upside if breached.











-
 Afghanistan
-
 Albania
-
 Algeria
-
 Angola
-
 Argentina
-
 Armenia
-
 Australia
-
 Austria
-
 Azerbaijan
-
 Bahamas
-
 Bahrain
-
 Bangladesh
-
 Belarus
-
 Belgium
-
 Bolivia
-
 Botswana
-
 Brazil
-
 Brunei
-
 Bulgaria
-
 Cambodia
-
 Cameroon
-
 Canada
-
 Chile
-
 China
-
 Colombia
-
 Congo
-
 Costa Rica
-
 Cote d'Ivoire
-
 Croatia
-
 Cuba
-
 Cyprus
-
 Czechia
-
 DR Congo
-
 Denmark
-
 Dominican Republic
-
 Ecuador
-
 Egypt
-
 El Salvador
-
 Estonia
-
 Eswatini
-
 Ethiopia
-
 Finland
-
 France
-
 Georgia
-
 Germany
-
 Ghana
-
 Greece
-
 Haiti
-
 Hong Kong
-
 Hungary
-
 India
-
 Indonesia
-
 Iran, Islamic republic
-
 Iraq
-
 Ireland
-
 Israel
-
 Italy
-
 Jamaica
-
 Japan
-
 Jordan
-
 Kazakhstan
-
 Kenya
-
 Korea
-
 Kuwait
-
 Kyrgyzstan
-
 Laos
-
 Latvia
-
 Lebanon
-
 Lesotho
-
 Libya
-
 Lithuania
-
 Luxembourg
-
 Madagascar
-
 Malaysia
-
 Malta
-
 Mauritius
-
 Mexico
-
 Moldova
-
 Mongolia
-
 Montenegro
-
 Morocco
-
 Mozambique
-
 Myanmar
-
 Namibia
-
 Nepal
-
 Netherlands
-
 New Zealand
-
 Nigeria
-
 North Macedonia
-
 Norway
-
 Oman
-
 Pakistan
-
 Palestine
-
 Panama
-
 Papua New Guinea
-
 Paraguay
-
 Peru
-
 Philippines
-
 Poland
-
 Portugal
-
 Puerto Rico
-
 Qatar
-
 Reunion
-
 Romania
-
 Rwanda
-
 Saudi Arabia
-
 Serbia
-
 Singapore
-
 Slovakia
-
 Slovenia
-
 Somalia
-
 South Africa
-
 Spain
-
 Sri Lanka
-
 Sweden
-
 Switzerland
-
 Syria
-
 Taiwan
-
 Tajikistan
-
 Tanzania
-
 Thailand
-
 Trinidad and Tobago
-
 Tunisia
-
 Turkey
-
 UAE
-
 Uganda
-
 Ukraine
-
 United Kingdom
-
United States
-
 Uruguay
-
 Uzbekistan
-
 Venezuela
-
 Vietnam
-
 Yemen
-
 Zambia
-
 Zimbabwe
- Forex
- Crypto












