

Mastercard stock softens further with downside momentum pushing into oversold zone: weekly analysis

Shares of Mastercard Inc (MA) remain pressured near $568, with the stock extending its decline by just over 2% this week as downside momentum stretched into oversold territory. The technical picture is complicated by mixed signals, as short-term momentum remains weak but some indicators point to a possible turn — setting up a tense outlook for the days ahead.
 616.42
633.25
Highlights
- Shares of Mastercard fell 2.01% over the past week to $567.72, breaking below short-term moving average levels.
- Short-term momentum has weakened, with bearish trend indicators and oversold signals, but MACD displays a buy divergence.
- Support is set at $567.16 and resistance at $578.19, with a projected range of $558.25 to $576.64 for next week.
Institutional stake hikes and new partnerships heighten sector relevance over the week
Institutional positioning was a central focus for MA after NEOS Investment Management LLC increased its stake by 10.4% during the second quarter of 2026, according to The Markets Daily. Mastercard's ongoing integration of AI and its role as a core payment network for several third-party infrastructure initiatives, including a newly announced stablecoin-backed card partnership between BVNK and Marqeta reported by FX News Group, added to sector interest. These developments underscore the asset's continued relevance in the payment space going into the week ahead.
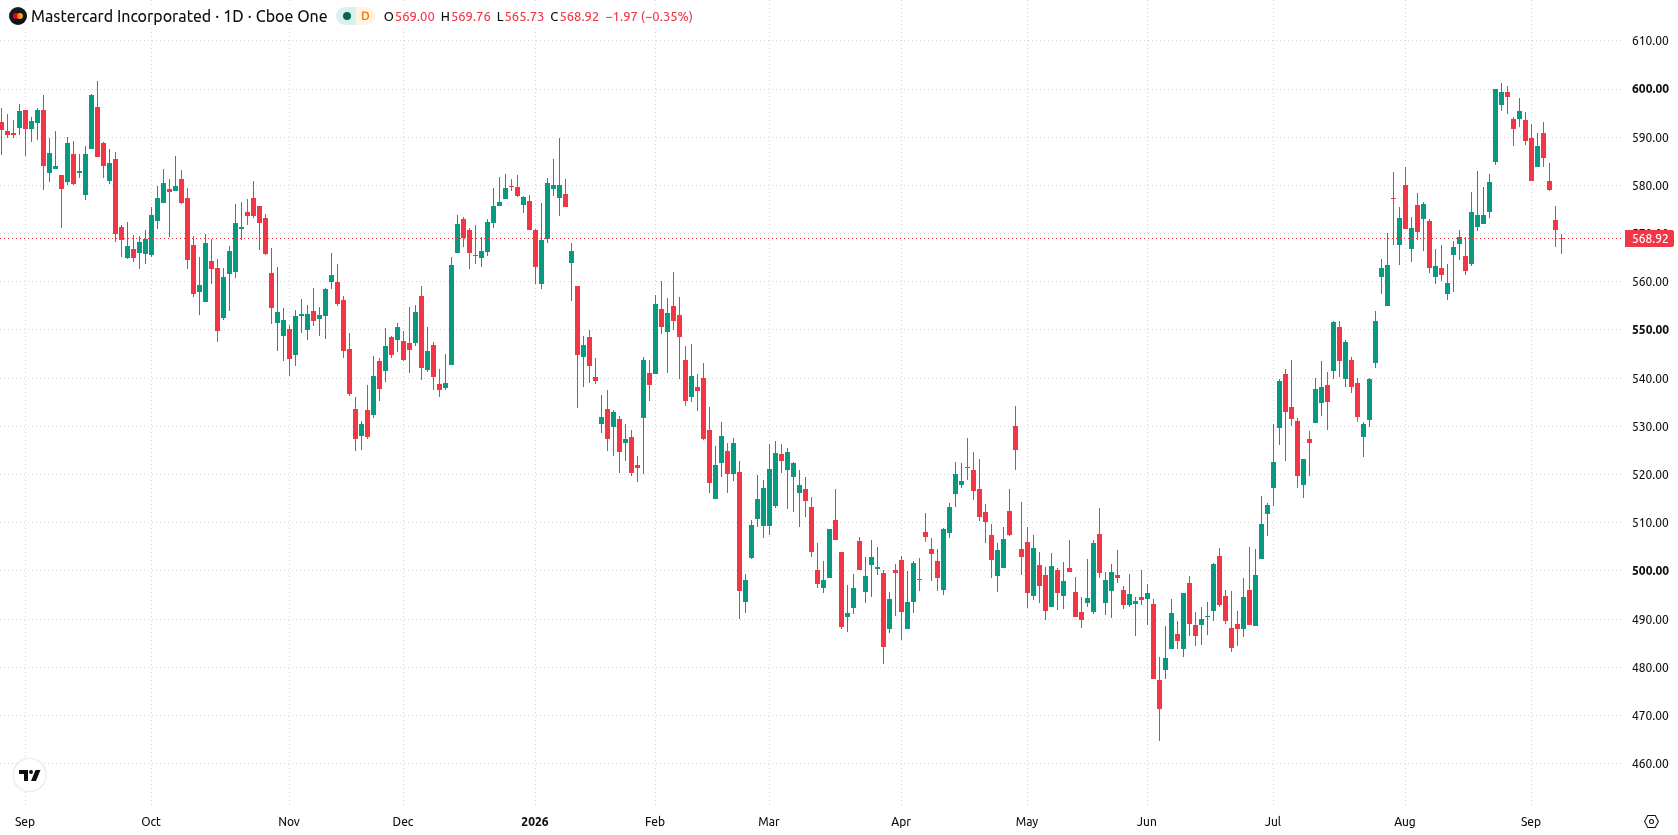
Bearish momentum prevails as indicator divergence complicates weekly technical outlook
The daily chart shows a sustained move lower with a firm trend, further highlighted by Bearish Bull/Bear Power readings and Stochastic RSI in the oversold zone. MACD, however, indicates a strong buy signal, creating a divergence among short-term momentum indicators. Volatility over the past week stands at 3.52%. The price is pinned to key support at $567.16, while resistance is set at the Ichimoku Kijun around $578.19.
Consolidation bias leads outlook with breakout risk at key range boundaries
Next week, the expected range is $558.25 to $576.64, with a 57% probability of an increase and 43% chance of a decrease. The base case sees the stock consolidating between support at $567.16 and resistance at $578.19. A bullish break above resistance would target the upper end of the range, while a drop below support may open a move toward $558.25.
Earlier, analysts noted that Mastercard’s strong performance and positive corporate developments were supporting an uptrend, while also cautioning about overstretched momentum indicators. The current slide toward oversold territory and mixed technical signals mark a notable shift, putting the spotlight on $567.16 support as a pivotal level for traders to watch in the coming week.











-
 Afghanistan
-
 Albania
-
 Algeria
-
 Angola
-
 Argentina
-
 Armenia
-
 Australia
-
 Austria
-
 Azerbaijan
-
 Bahamas
-
 Bahrain
-
 Bangladesh
-
 Belarus
-
 Belgium
-
 Bolivia
-
 Botswana
-
 Brazil
-
 Brunei
-
 Bulgaria
-
 Cambodia
-
 Cameroon
-
 Canada
-
 Chile
-
 China
-
 Colombia
-
 Congo
-
 Costa Rica
-
 Cote d'Ivoire
-
 Croatia
-
 Cuba
-
 Cyprus
-
 Czechia
-
 DR Congo
-
 Denmark
-
 Dominican Republic
-
 Ecuador
-
 Egypt
-
 El Salvador
-
 Estonia
-
 Eswatini
-
 Ethiopia
-
 Finland
-
 France
-
 Georgia
-
 Germany
-
 Ghana
-
 Greece
-
 Haiti
-
 Hong Kong
-
 Hungary
-
 India
-
 Indonesia
-
 Iran, Islamic republic
-
 Iraq
-
 Ireland
-
 Israel
-
 Italy
-
 Jamaica
-
 Japan
-
 Jordan
-
 Kazakhstan
-
 Kenya
-
 Korea
-
 Kuwait
-
 Kyrgyzstan
-
 Laos
-
 Latvia
-
 Lebanon
-
 Lesotho
-
 Libya
-
 Lithuania
-
 Luxembourg
-
 Madagascar
-
 Malaysia
-
 Malta
-
 Mauritius
-
 Mexico
-
 Moldova
-
 Mongolia
-
 Montenegro
-
 Morocco
-
 Mozambique
-
 Myanmar
-
 Namibia
-
 Nepal
-
 Netherlands
-
 New Zealand
-
 Nigeria
-
 North Macedonia
-
 Norway
-
 Oman
-
 Pakistan
-
 Palestine
-
 Panama
-
 Papua New Guinea
-
 Paraguay
-
 Peru
-
 Philippines
-
 Poland
-
 Portugal
-
 Puerto Rico
-
 Qatar
-
 Reunion
-
 Romania
-
 Rwanda
-
 Saudi Arabia
-
 Serbia
-
 Singapore
-
 Slovakia
-
 Slovenia
-
 Somalia
-
 South Africa
-
 Spain
-
 Sri Lanka
-
 Sweden
-
 Switzerland
-
 Syria
-
 Taiwan
-
 Tajikistan
-
 Tanzania
-
 Thailand
-
 Trinidad and Tobago
-
 Tunisia
-
 Turkey
-
 UAE
-
 Uganda
-
 Ukraine
-
 United Kingdom
-
United States
-
 Uruguay
-
 Uzbekistan
-
 Venezuela
-
 Vietnam
-
 Yemen
-
 Zambia
-
 Zimbabwe
- Forex
- Crypto












