

Nvidia stock price prediction: Resistance test at $215.47 in focus after bumper buybacks

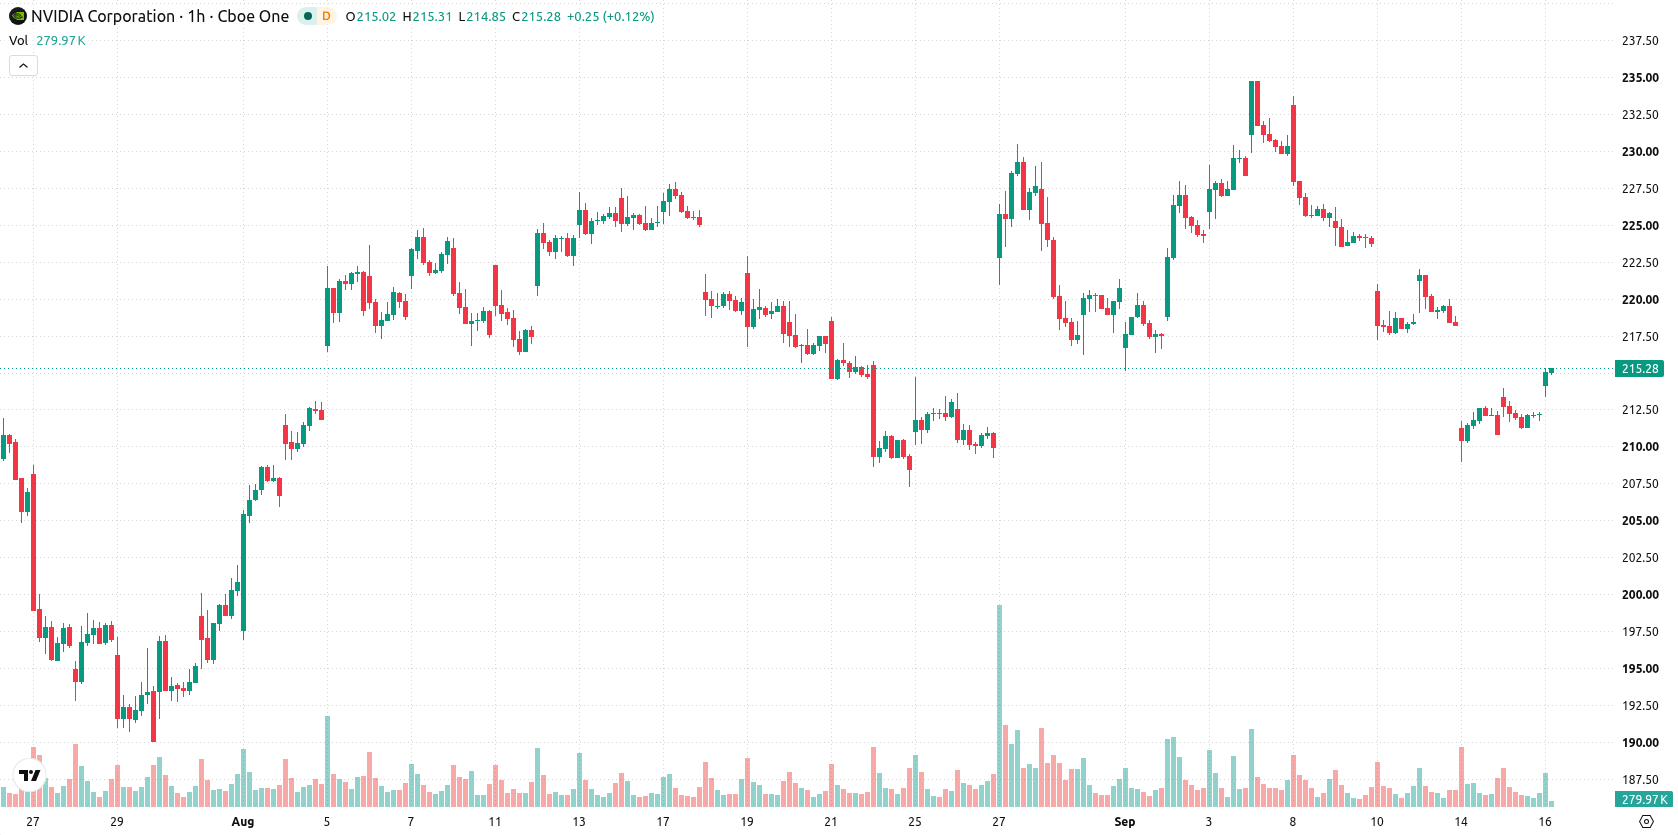
Nvidia (NVDA) stock is trading at $215.09, up 1.38% on the day. The price stands above its key short-term averages, with intraday movement finishing near the daily high and showing moderate volatility.
 161.38
177.53
Highlights
- Nvidia reported second fiscal quarter 2027 revenue of $96.2 billion and returned a record $26 billion to shareholders through dividends and buybacks.
- The quarterly dividend increased to $0.25 per share, with substantial capital returns drawing strong interest from income-focused and institutional investors.
- Nvidia stock is forecast to trade between $209.29 and $220.89 over the next three days, with technical indicators favoring a sideways to downward move and resistance at $215.47.
Shareholder returns boost liquidity amid mixed institutional flows
Nvidia's recent financial disclosures, as reported by Diariobitcoin, show second fiscal quarter 2027 revenue at $96.2 billion and a record $26 billion returned to shareholders via dividends and share buybacks, with the quarterly dividend raised to $0.25 per share. This substantial capital return directly enhances the stock's liquidity and yield, driving interest from both income-oriented and institutional investors. Meanwhile, Marketbeat noted that Nan Fung Trinity HK Ltd. reduced its stake by 21.7% during the second quarter, highlighting mixed institutional flows but not offsetting the prevailing positive backdrop from Nvidia's payout policy.
Mixed momentum as price nears resistance despite weak trend signals
On the technical front, NVDA trades above its MA-20 but remains below the MA-50 on the hourly chart, and it is well above the MA-200 on the daily timeframe. The Ichimoku Kijun sits at $215.47 and now acts as immediate resistance. Among momentum indicators, MACD signals strong sell, ADX also suggests a sell bias, and RSI is at 39.39, indicating a bearish setting. Stoch RSI stands in overbought territory, CCI is neutral, and Bull/Bear Power continues to show sellers with the intraday upper hand. While Stoch RSI signals potential overheating, the momentum picture remains mixed with a notable divergence between overbought oscillators and persistent weakness in trend indicators.
Sideways trading likely as downside risk outweighs breakout odds
In the short term, NVDA is expected to move within a volatility band of $209.29 to $220.89 over the next 2–3 trading days. The probability of a downward move is greater at 60%, while the chance of a sustained upside move is about 40%. The baseline scenario is for the price to consolidate sideways within this range. If the price breaks above $215.47 resistance, it could approach the upper end of the range, while a drop below $209.29 support may lead to a deeper correction.
Earlier, analysts noted that Nvidia's stock was vulnerable to technical selling pressure despite supportive political developments and a generally rangebound outlook. The current article adds a new dimension by highlighting Nvidia's robust capital return program and recent institutional activity, with traders now advised to monitor $215.47 as a key resistance level for signals of a potential breakout or renewed downside.






Latest NVIDIA News





-
 Afghanistan
-
 Albania
-
 Algeria
-
 Angola
-
 Argentina
-
 Armenia
-
 Australia
-
 Austria
-
 Azerbaijan
-
 Bahamas
-
 Bahrain
-
 Bangladesh
-
 Belarus
-
 Belgium
-
 Bolivia
-
 Botswana
-
 Brazil
-
 Brunei
-
 Bulgaria
-
 Cambodia
-
 Cameroon
-
 Canada
-
 Chile
-
 China
-
 Colombia
-
 Congo
-
 Costa Rica
-
 Cote d'Ivoire
-
 Croatia
-
 Cuba
-
 Cyprus
-
 Czechia
-
 DR Congo
-
 Denmark
-
 Dominican Republic
-
 Ecuador
-
 Egypt
-
 El Salvador
-
 Estonia
-
 Eswatini
-
 Ethiopia
-
 Finland
-
 France
-
 Georgia
-
 Germany
-
 Ghana
-
 Greece
-
 Haiti
-
 Hong Kong
-
 Hungary
-
 India
-
 Indonesia
-
 Iran, Islamic republic
-
 Iraq
-
 Ireland
-
 Israel
-
 Italy
-
 Jamaica
-
 Japan
-
 Jordan
-
 Kazakhstan
-
 Kenya
-
 Korea
-
 Kuwait
-
 Kyrgyzstan
-
 Laos
-
 Latvia
-
 Lebanon
-
 Lesotho
-
 Libya
-
 Lithuania
-
 Luxembourg
-
 Madagascar
-
 Malaysia
-
 Malta
-
 Mauritius
-
 Mexico
-
 Moldova
-
 Mongolia
-
 Montenegro
-
 Morocco
-
 Mozambique
-
 Myanmar
-
 Namibia
-
 Nepal
-
 Netherlands
-
 New Zealand
-
 Nigeria
-
 North Macedonia
-
 Norway
-
 Oman
-
 Pakistan
-
 Palestine
-
 Panama
-
 Papua New Guinea
-
 Paraguay
-
 Peru
-
 Philippines
-
 Poland
-
 Portugal
-
 Puerto Rico
-
 Qatar
-
 Reunion
-
 Romania
-
 Rwanda
-
 Saudi Arabia
-
 Serbia
-
 Singapore
-
 Slovakia
-
 Slovenia
-
 Somalia
-
 South Africa
-
 Spain
-
 Sri Lanka
-
 Sweden
-
 Switzerland
-
 Syria
-
 Taiwan
-
 Tajikistan
-
 Tanzania
-
 Thailand
-
 Trinidad and Tobago
-
 Tunisia
-
 Turkey
-
 UAE
-
 Uganda
-
 Ukraine
-
 United Kingdom
-
United States
-
 Uruguay
-
 Uzbekistan
-
 Venezuela
-
 Vietnam
-
 Yemen
-
 Zambia
-
 Zimbabwe
- Forex
- Crypto












