

Why is Goldman Sachs stock down today? Interest rate concerns weigh with weak momentum

Goldman Sachs (GS) stock is trading at $937.93, marking a daily decline of 3.97%. The price sits below its key moving averages, reflecting persistent downward pressure from sellers in recent sessions.
 932.74
939.28
Highlights
- Goldman Sachs raised $11.7 billion for new private equity funds, signaling sustained institutional demand for its alternatives platform.
- The company reported full-year revenue of $117.10 billion and net profit of $16.30 billion, setting a strong operational base amid broader share selling pressure.
- Shares trade below major moving averages with technical indicators showing dominant bearish momentum and an expected near-term range of $900.70 to $975.16.
Strong institutional inflows in alternatives offset by macro caution
Goldman Sachs Group Inc.'s alternatives business raised $11.7 billion across new private equity funds as of September 15, 2026, according to Newsbreak. This substantial inflow into alternative asset strategies reflects ongoing institutional interest and provides strategic capital to support future earnings, though it was not sufficient to counteract current macroeconomic uncertainty and associated investor caution. Recent figures showed annual revenue reaching $117.10 billion with net profit at $16.30 billion for the full year, establishing a solid operational baseline even as shares experienced increased selling pressure in the broader market.
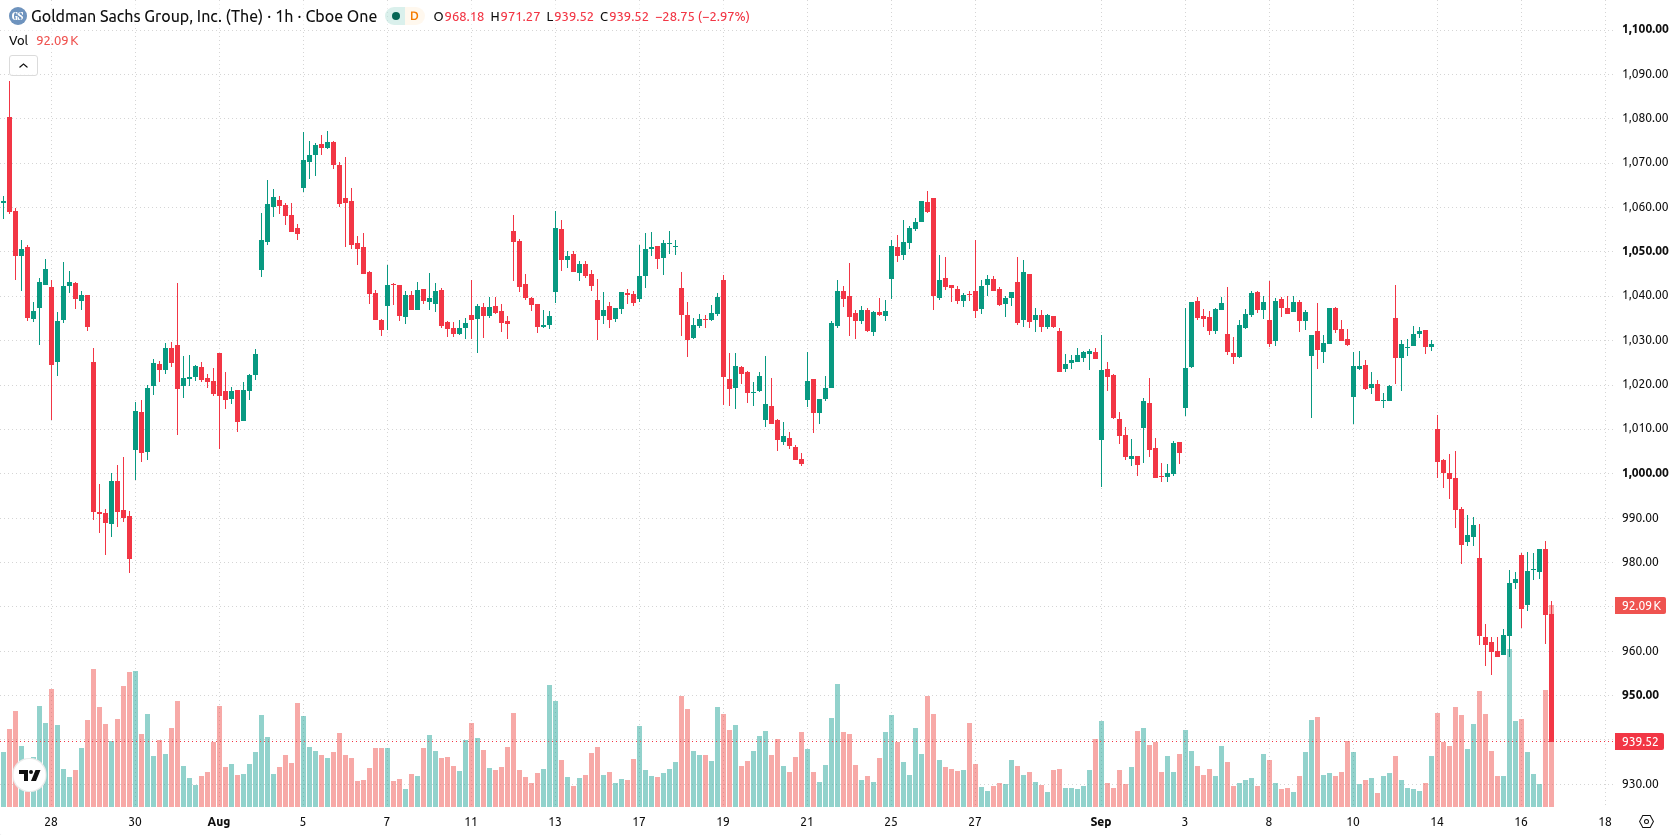
Bearish momentum dominates as major averages and indicators confirm downside
GS is trading below the MA-20 and MA-50 on the hourly chart and remains below the MA-200 on the daily timeframe, indicating prolonged downside momentum. The Ichimoku Kijun at $998.74 now acts as immediate resistance. Price currently sits near its intraday low of $937.93. Momentum indicators remain bearish: MACD signals a strong sell, ADX supports the prevailing downward structure, and RSI is at 38.79 (indicative of ongoing selling). Stoch RSI shows overbought conditions while CCI appears neutral, resulting in divergence among short-term oscillators. Bull/Bear Power also points to an overbought market, suggesting that buyer activity persists despite the broader price weakness, while the Awesome Oscillator reads neutral.
Continued downside risk as volatility persists within established trading band
GS is likely to remain volatile within a price range of $900.70 to $975.16 over the next 2–3 trading days, representing a typical volatility band relative to current levels. The probability of an upward move from here is very low, while there is a very high probability of continued downward movement if bearish momentum persists. The baseline scenario calls for price action to remain largely rangebound unless $900.70 is decisively breached on the downside or a breakout above the Ichimoku Kijun resistance at $998.74 occurs.
Earlier, analysts noted that Goldman Sachs exhibited a neutral-to-bearish technical structure amid persistent macroeconomic headwinds and challenging Federal Reserve policy. The latest price action and continued downside momentum confirm this view, with $900.70 emerging as a critical support level for traders to monitor for potential breakdown or stabilization.






Latest Goldman Sachs News





-
 Afghanistan
-
 Albania
-
 Algeria
-
 Angola
-
 Argentina
-
 Armenia
-
 Australia
-
 Austria
-
 Azerbaijan
-
 Bahamas
-
 Bahrain
-
 Bangladesh
-
 Belarus
-
 Belgium
-
 Bolivia
-
 Botswana
-
 Brazil
-
 Brunei
-
 Bulgaria
-
 Cambodia
-
 Cameroon
-
 Canada
-
 Chile
-
 China
-
 Colombia
-
 Congo
-
 Costa Rica
-
 Cote d'Ivoire
-
 Croatia
-
 Cuba
-
 Cyprus
-
 Czechia
-
 DR Congo
-
 Denmark
-
 Dominican Republic
-
 Ecuador
-
 Egypt
-
 El Salvador
-
 Estonia
-
 Eswatini
-
 Ethiopia
-
 Finland
-
 France
-
 Georgia
-
 Germany
-
 Ghana
-
 Greece
-
 Haiti
-
 Hong Kong
-
 Hungary
-
 India
-
 Indonesia
-
 Iran, Islamic republic
-
 Iraq
-
 Ireland
-
 Israel
-
 Italy
-
 Jamaica
-
 Japan
-
 Jordan
-
 Kazakhstan
-
 Kenya
-
 Korea
-
 Kuwait
-
 Kyrgyzstan
-
 Laos
-
 Latvia
-
 Lebanon
-
 Lesotho
-
 Libya
-
 Lithuania
-
 Luxembourg
-
 Madagascar
-
 Malaysia
-
 Malta
-
 Mauritius
-
 Mexico
-
 Moldova
-
 Mongolia
-
 Montenegro
-
 Morocco
-
 Mozambique
-
 Myanmar
-
 Namibia
-
 Nepal
-
 Netherlands
-
 New Zealand
-
 Nigeria
-
 North Macedonia
-
 Norway
-
 Oman
-
 Pakistan
-
 Palestine
-
 Panama
-
 Papua New Guinea
-
 Paraguay
-
 Peru
-
 Philippines
-
 Poland
-
 Portugal
-
 Puerto Rico
-
 Qatar
-
 Reunion
-
 Romania
-
 Rwanda
-
 Saudi Arabia
-
 Serbia
-
 Singapore
-
 Slovakia
-
 Slovenia
-
 Somalia
-
 South Africa
-
 Spain
-
 Sri Lanka
-
 Sweden
-
 Switzerland
-
 Syria
-
 Taiwan
-
 Tajikistan
-
 Tanzania
-
 Thailand
-
 Trinidad and Tobago
-
 Tunisia
-
 Turkey
-
 UAE
-
 Uganda
-
 Ukraine
-
 United Kingdom
-
United States
-
 Uruguay
-
 Uzbekistan
-
 Venezuela
-
 Vietnam
-
 Yemen
-
 Zambia
-
 Zimbabwe
- Forex
- Crypto












