

Verizon shares eye breakout potential as support at $49.14 and resistance at $49.33 define outlook: weekly analysis

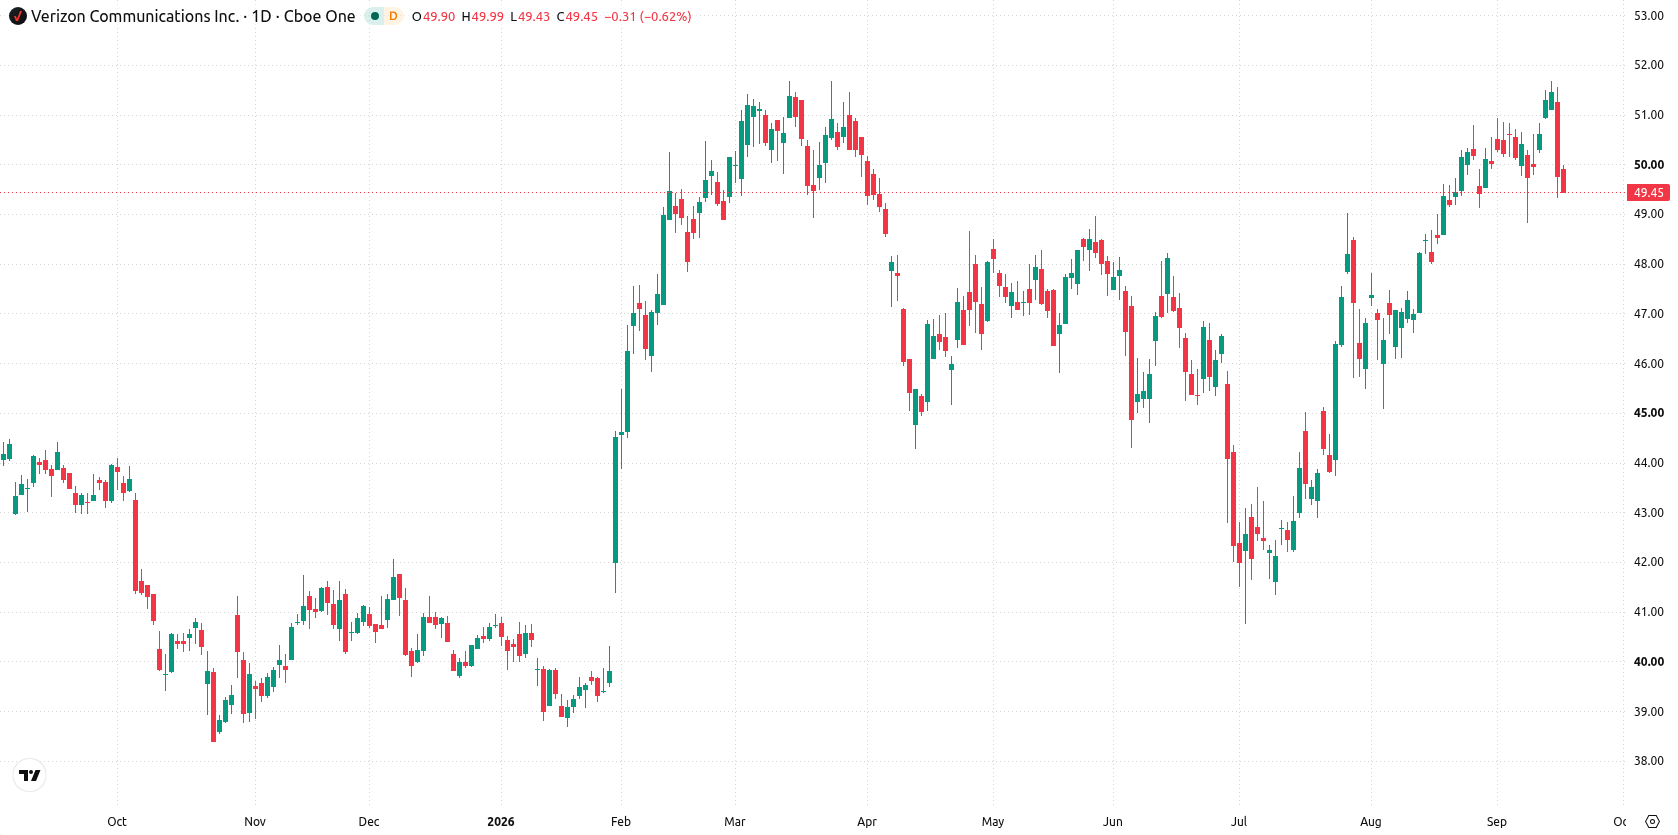
Shares of Verizon Communications Inc. (VZ) are trading near $49, with sellers keeping pressure as the stock closed the week with a decline of nearly 3%. The chart shows momentum signals in conflict and the setup deep in oversold territory, with price action locked in a tight range. This standoff signals a pivotal week ahead as buyers and sellers weigh a potential breakout.
 45.03
45.58
Highlights
- Shares of Verizon dropped 2.78% over the past 7 days to $49.19 and are in a consolidation pattern.
- Technical setup is broadly bullish over the longer term, though short-term signals are mixed with stretched downside momentum.
- The stock is expected to trade in a $48.14 to $51 range next week, with a 52% probability of an increase.
Dividend declaration and tech partnerships stabilize sentiment after lawsuit resolution
Verizon declared its quarterly dividend on September 9, 2026, a move that often reflects confidence in underlying cash flow and can stabilize sentiment in the coming week. The company also broadened its 6G Innovation Forum, adding major technology partners such as AWS, Cisco, and NVIDIA, and reported real-world progress on ISAC technology and an AI sports companion, according to GlobeNewswire and StockTitan. Meanwhile, EVP Kyle Malady disclosed a planned and executed sale of 1,100 shares at $51.19, and within the past week Verizon and T-Mobile resolved lawsuits over advertising claims, as reported by Investing.com.
MACD buy bias meets oversold RSI as price compresses between key levels
On the daily chart, the move has been a contained move within a narrow range, with volatility over the past week at 4.74%. Momentum signals are mixed: the MACD stands at 0.94 with a strong buy bias, while Stochastic RSI reads 0 and is in the oversold zone, suggesting downside pressure is becoming stretched. The stock is holding at support from the Ichimoku Kijun at $49.14 and is simultaneously pinned to resistance at $49.33, reflecting a standoff within tightly defined boundaries.
Breakout risk grows as next week’s range narrows between support and resistance
Next week, the expected range is $48.14 to $51, with a 52% probability of an increase and a 48% probability of a decrease. The base case sees the stock consolidating between the support at $49.14 and resistance at $49.33. A bullish scenario would emerge if shares break and hold above $49.33, opening the way toward the upper boundary of the projected range. Conversely, a drop below $49.14 would trigger further downside risk toward $48.14.
Earlier, analysts noted that Verizon continued to show stable long-term trends despite persistent short-term selling pressure and a mixed technical outlook. The latest trading action introduces a deepening standoff at key support and resistance levels, making next week's price reaction at $49.14 and $49.33 especially significant for traders seeking early signals of any directional breakout.








-
 Afghanistan
-
 Albania
-
 Algeria
-
 Angola
-
 Argentina
-
 Armenia
-
 Australia
-
 Austria
-
 Azerbaijan
-
 Bahamas
-
 Bahrain
-
 Bangladesh
-
 Belarus
-
 Belgium
-
 Bolivia
-
 Botswana
-
 Brazil
-
 Brunei
-
 Bulgaria
-
 Cambodia
-
 Cameroon
-
 Canada
-
 Chile
-
 China
-
 Colombia
-
 Congo
-
 Costa Rica
-
 Cote d'Ivoire
-
 Croatia
-
 Cuba
-
 Cyprus
-
 Czechia
-
 DR Congo
-
 Denmark
-
 Dominican Republic
-
 Ecuador
-
 Egypt
-
 El Salvador
-
 Estonia
-
 Eswatini
-
 Ethiopia
-
 Finland
-
 France
-
 Georgia
-
 Germany
-
 Ghana
-
 Greece
-
 Haiti
-
 Hong Kong
-
 Hungary
-
 India
-
 Indonesia
-
 Iran, Islamic republic
-
 Iraq
-
 Ireland
-
 Israel
-
 Italy
-
 Jamaica
-
 Japan
-
 Jordan
-
 Kazakhstan
-
 Kenya
-
 Korea
-
 Kuwait
-
 Kyrgyzstan
-
 Laos
-
 Latvia
-
 Lebanon
-
 Lesotho
-
 Libya
-
 Lithuania
-
 Luxembourg
-
 Madagascar
-
 Malaysia
-
 Malta
-
 Mauritius
-
 Mexico
-
 Moldova
-
 Mongolia
-
 Montenegro
-
 Morocco
-
 Mozambique
-
 Myanmar
-
 Namibia
-
 Nepal
-
 Netherlands
-
 New Zealand
-
 Nigeria
-
 North Macedonia
-
 Norway
-
 Oman
-
 Pakistan
-
 Palestine
-
 Panama
-
 Papua New Guinea
-
 Paraguay
-
 Peru
-
 Philippines
-
 Poland
-
 Portugal
-
 Puerto Rico
-
 Qatar
-
 Reunion
-
 Romania
-
 Rwanda
-
 Saudi Arabia
-
 Serbia
-
 Singapore
-
 Slovakia
-
 Slovenia
-
 Somalia
-
 South Africa
-
 Spain
-
 Sri Lanka
-
 Sweden
-
 Switzerland
-
 Syria
-
 Taiwan
-
 Tajikistan
-
 Tanzania
-
 Thailand
-
 Trinidad and Tobago
-
 Tunisia
-
 Turkey
-
 UAE
-
 Uganda
-
 Ukraine
-
 United Kingdom
-
United States
-
 Uruguay
-
 Uzbekistan
-
 Venezuela
-
 Vietnam
-
 Yemen
-
 Zambia
-
 Zimbabwe
- Forex
- Crypto












