


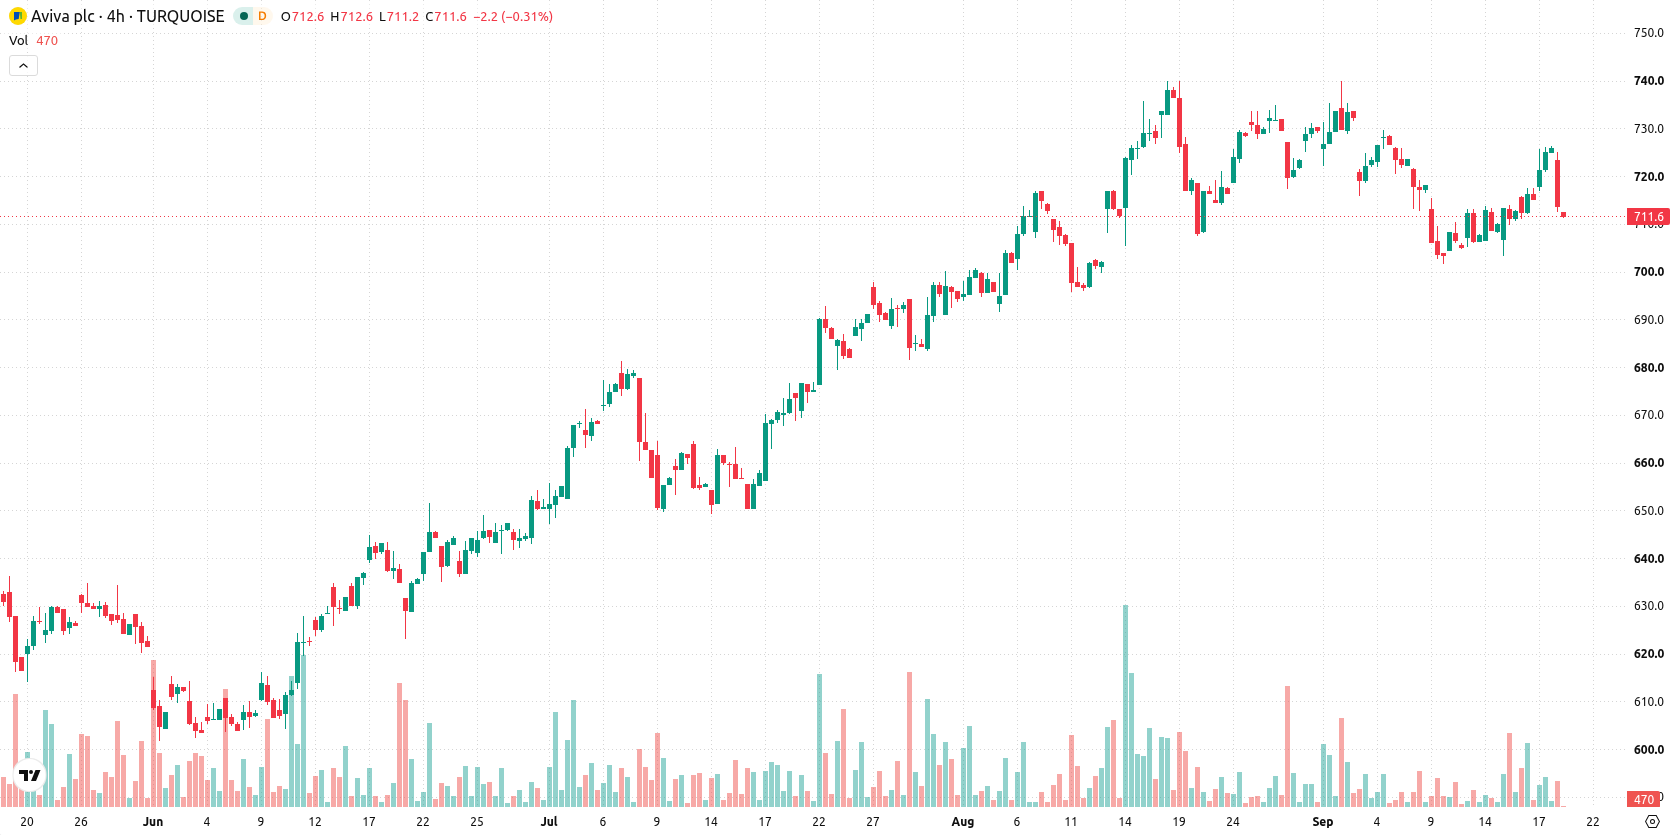
Aviva plc (AV) dropped 2.07% today as short-term selling pressure intensified, with current price action underlined by technical weakness near immediate support levels. This downside is reinforced by the stock trading below its 20-day moving average and sellers controlling the near-term tone.
 735.20
Highlights
- Shares of Aviva have slipped 2.07% to GBX710.8, trading near today's low, with sellers in control and intraday volatility at 1.66%.
- The stock is showing short-term selling pressure but remains above key medium- and long-term moving averages, indicating an intact bullish trend structure.
- For the next five trading days, the expected range is GBX699 to GBX722.6, with a high probability of sideways to upward movement and major resistance at GBX718.2.
Short-term losses offset by longer-term bullish structure and mixed momentum
Aviva is currently trading below its 20-day moving average (GBX720.48) but above both its 50-day (GBX703.06) and 200-day (GBX656.59) moving averages. This structure points to short-term selling pressure within a medium- and long-term bullish trend, with the Ichimoku Kijun at GBX718.2 acting as near-term resistance. Immediate support is at the 50-day moving average, now the near-term floor. Momentum indicators show mixed signals. The Moving Average Convergence Divergence (MACD) has a strong buy signal, but the Average Directional Index (ADX) is neutral, suggesting weak trend strength. The Relative Strength Index (RSI) is in bullish territory at 58.34, and Stochastic RSI is neutral at 71.79, reflecting no clear overbought condition. Commodity Channel Index (CCI) and Awesome Oscillator (AO) are both neutral. Bull/Bear Power (BBP) signals that buyers still dominate, but the 'overbought' warning hints at limited immediate upside. The stock has declined to GBX710.8, slipping 2.07% for the day after a downside gap of roughly 0.19%. Price is trading near today's low, with intraday volatility at 1.66%. Intraday tone is weak, with sellers in control following early pressure.
Earlier, analysts noted that Aviva was under persistent selling pressure despite background support from dividend increases, with technicals signaling downside risk and potential for further declines. The current analysis points to a shift, as mixed momentum indicators and a supportive moving average structure highlight a bullish bias within a defined trading range, making a break above GBX712.6 the key level for short-term direction.










-
 Afghanistan
-
 Albania
-
 Algeria
-
 Angola
-
 Argentina
-
 Armenia
-
 Australia
-
 Austria
-
 Azerbaijan
-
 Bahamas
-
 Bahrain
-
 Bangladesh
-
 Belarus
-
 Belgium
-
 Bolivia
-
 Botswana
-
 Brazil
-
 Brunei
-
 Bulgaria
-
 Cambodia
-
 Cameroon
-
 Canada
-
 Chile
-
 China
-
 Colombia
-
 Congo
-
 Costa Rica
-
 Cote d'Ivoire
-
 Croatia
-
 Cuba
-
 Cyprus
-
 Czechia
-
 DR Congo
-
 Denmark
-
 Dominican Republic
-
 Ecuador
-
 Egypt
-
 El Salvador
-
 Estonia
-
 Eswatini
-
 Ethiopia
-
 Finland
-
 France
-
 Georgia
-
 Germany
-
 Ghana
-
 Greece
-
 Haiti
-
 Hong Kong
-
 Hungary
-
 India
-
 Indonesia
-
 Iran, Islamic republic
-
 Iraq
-
 Ireland
-
 Israel
-
 Italy
-
 Jamaica
-
 Japan
-
 Jordan
-
 Kazakhstan
-
 Kenya
-
 Korea
-
 Kuwait
-
 Kyrgyzstan
-
 Laos
-
 Latvia
-
 Lebanon
-
 Lesotho
-
 Libya
-
 Lithuania
-
 Luxembourg
-
 Madagascar
-
 Malaysia
-
 Malta
-
 Mauritius
-
 Mexico
-
 Moldova
-
 Mongolia
-
 Montenegro
-
 Morocco
-
 Mozambique
-
 Myanmar
-
 Namibia
-
 Nepal
-
 Netherlands
-
 New Zealand
-
 Nigeria
-
 North Macedonia
-
 Norway
-
 Oman
-
 Pakistan
-
 Palestine
-
 Panama
-
 Papua New Guinea
-
 Paraguay
-
 Peru
-
 Philippines
-
 Poland
-
 Portugal
-
 Puerto Rico
-
 Qatar
-
 Reunion
-
 Romania
-
 Rwanda
-
 Saudi Arabia
-
 Serbia
-
 Singapore
-
 Slovakia
-
 Slovenia
-
 Somalia
-
 South Africa
-
 Spain
-
 Sri Lanka
-
 Sweden
-
 Switzerland
-
 Syria
-
 Taiwan
-
 Tajikistan
-
 Tanzania
-
 Thailand
-
 Trinidad and Tobago
-
 Tunisia
-
 Turkey
-
 UAE
-
 Uganda
-
 Ukraine
-
 United Kingdom
-
United States
-
 Uruguay
-
 Uzbekistan
-
 Venezuela
-
 Vietnam
-
 Yemen
-
 Zambia
-
 Zimbabwe
- Forex
- Crypto












