

Chevron shares technical analysis: Support test at $207.43 keeps traders cautious

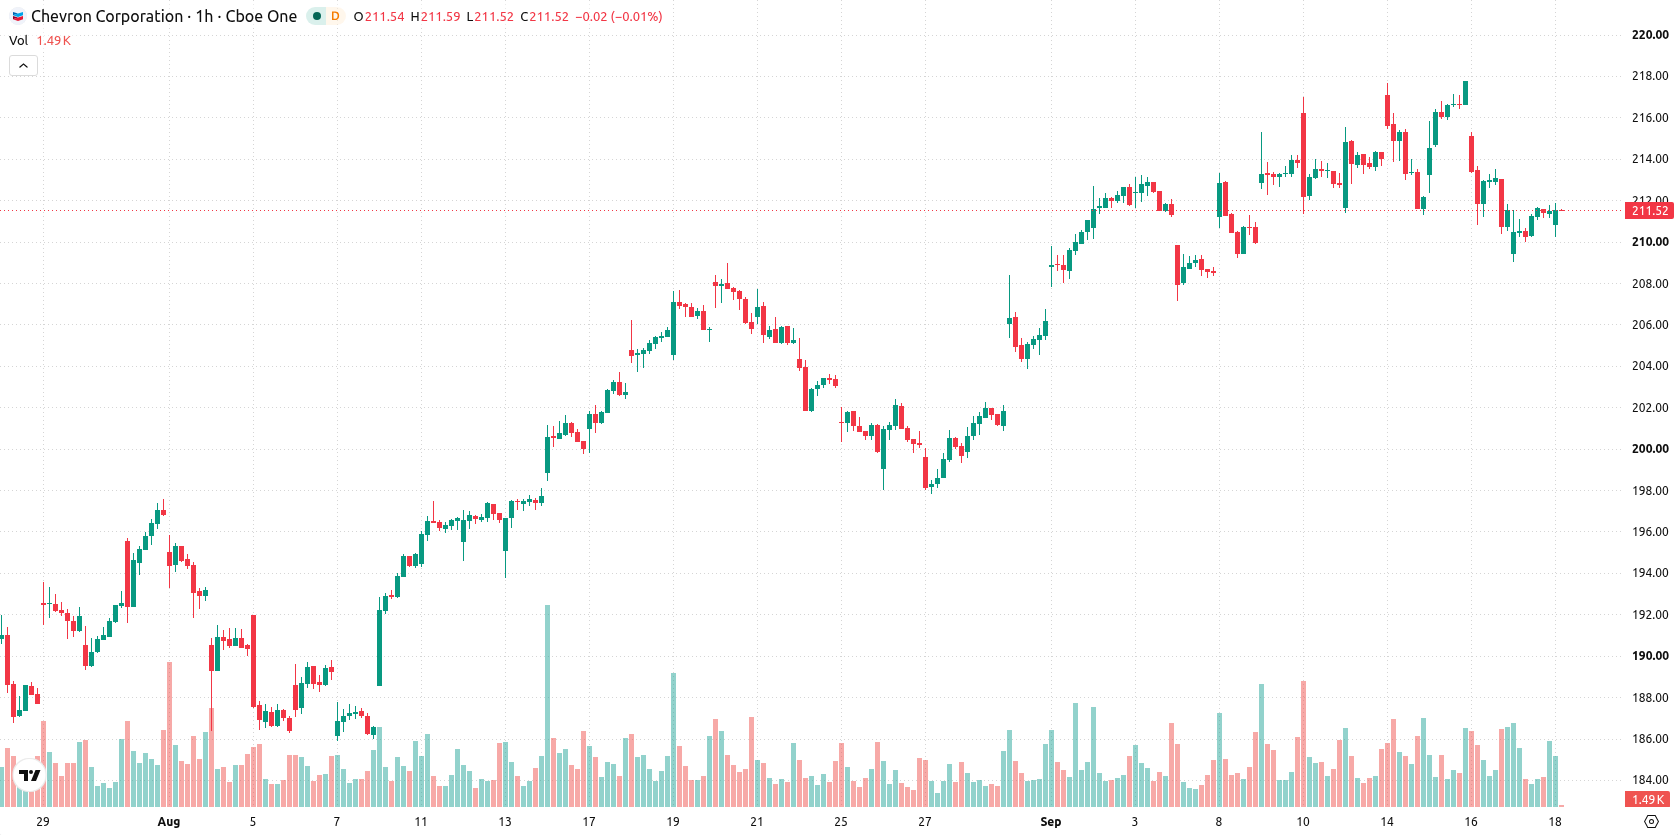
Chevron (CVX) stock is trading at $211.28, edging lower for the day in a moderately volatile session. The price is currently positioned below its short- and medium-term moving averages, while holding above its long-term trend levels.
 222.53
218.76
222.53
218.76
Highlights
- Chevron stock trades below short- and medium-term moving averages with immediate resistance at $213.48, indicating continued selling pressure.
- Momentum indicators remain broadly negative and show a downward bias, but oscillators are mixed with some signals of buyer presence.
- Chevron stock is expected to remain in a $207.43 to $215.13 range over several days, with a 70% down probability.
Mixed momentum signals amid resistance near daily Ichimoku Kijun
On the technical front, CVX is trading below its MA-20 at $212.75 and MA-50 at $213.35 on the 1-hour chart, but remains above the long-term MA-200 at $183.61 on the daily timeframe. The daily Ichimoku Kijun level at $213.48 now acts as immediate resistance. Momentum indicators are mixed: MACD shows a Strong Sell signal, ADX also favors sellers, and RSI sits at 47.42, offering a mild Sell bias. Oscillator readings are uneven, with Stochastic RSI in Overbought territory, CCI remaining Neutral, and Bull/Bear Power indicating a Buy signal, highlighting some underlying buyer presence amid broader negative momentum.
Downside risk outweighs upside amid well-defined trading range
Looking ahead, CVX is likely to hold within a trading range of $207.43 to $215.13 over the coming days, consistent with typical volatility for the name. The probability of an upside breakout is estimated at 30%, while downside risk is higher at 70%. A move above the Ichimoku Kijun at $213.48 could trigger a shift in sentiment to the upside, whereas a drop below $207.43 would reinforce the current downward bias.
Previously it was reported that Chevron faced sustained downward pressure, with technical signals suggesting an ongoing risk of further consolidation or declines. The current analysis reinforces this view, highlighting a prevailing downside risk and emphasizing $213.48 as a key level that could signal a shift if surpassed.











-
 Afghanistan
-
 Albania
-
 Algeria
-
 Angola
-
 Argentina
-
 Armenia
-
 Australia
-
 Austria
-
 Azerbaijan
-
 Bahamas
-
 Bahrain
-
 Bangladesh
-
 Belarus
-
 Belgium
-
 Bolivia
-
 Botswana
-
 Brazil
-
 Brunei
-
 Bulgaria
-
 Cambodia
-
 Cameroon
-
 Canada
-
 Chile
Chile
-
 China
China
-
 Colombia
-
 Congo
Congo
-
 Costa Rica
-
 Cote d'Ivoire
-
 Croatia
-
 Cuba
Cuba
-
 Cyprus
-
 Czechia
-
 DR Congo
-
 Denmark
-
 Dominican Republic
-
 Ecuador
-
 Egypt
Egypt
-
 El Salvador
-
 Estonia
-
 Eswatini
-
 Ethiopia
-
 Finland
-
 France
-
 Georgia
-
 Germany
-
 Ghana
Ghana
-
 Greece
-
 Haiti
Haiti
-
 Hong Kong
-
 Hungary
-
 India
India
-
 Indonesia
-
 Iran, Islamic republic
-
 Iraq
Iraq
-
 Ireland
-
 Israel
-
 Italy
Italy
-
 Jamaica
-
 Japan
Japan
-
 Jordan
-
 Kazakhstan
-
 Kenya
Kenya
-
 Korea
Korea
-
 Kuwait
-
 Kyrgyzstan
-
 Laos
Laos
-
 Latvia
-
 Lebanon
-
 Lesotho
-
 Libya
Libya
-
 Lithuania
-
 Luxembourg
-
 Madagascar
-
 Malaysia
-
 Malta
Malta
-
 Mauritius
-
 Mexico
-
 Moldova
-
 Mongolia
-
 Montenegro
-
 Morocco
-
 Mozambique
-
 Myanmar
-
 Namibia
-
 Nepal
Nepal
-
 Netherlands
-
 New Zealand
-
 Nigeria
-
 North Macedonia
-
 Norway
-
 Oman
Oman
-
 Pakistan
-
 Palestine
-
 Panama
-
 Papua New Guinea
-
 Paraguay
-
 Peru
Peru
-
 Philippines
-
 Poland
-
 Portugal
-
 Puerto Rico
-
 Qatar
Qatar
-
 Reunion
-
 Romania
-
 Rwanda
-
 Saudi Arabia
-
 Serbia
-
 Singapore
-
 Slovakia
-
 Slovenia
-
 Somalia
-
 South Africa
-
 Spain
Spain
-
 Sri Lanka
-
 Sweden
-
 Switzerland
-
 Syria
Syria
-
 Taiwan
-
 Tajikistan
-
 Tanzania
-
 Thailand
-
 Trinidad and Tobago
-
 Tunisia
-
 Turkey
-
 UAE
UAE
-
 Uganda
-
 Ukraine
-
 United Kingdom
-
United States
-
 Uruguay
-
 Uzbekistan
-
 Venezuela
-
 Vietnam
-
 Yemen
Yemen
-
 Zambia
-
 Zimbabwe
- Forex
- Crypto












