


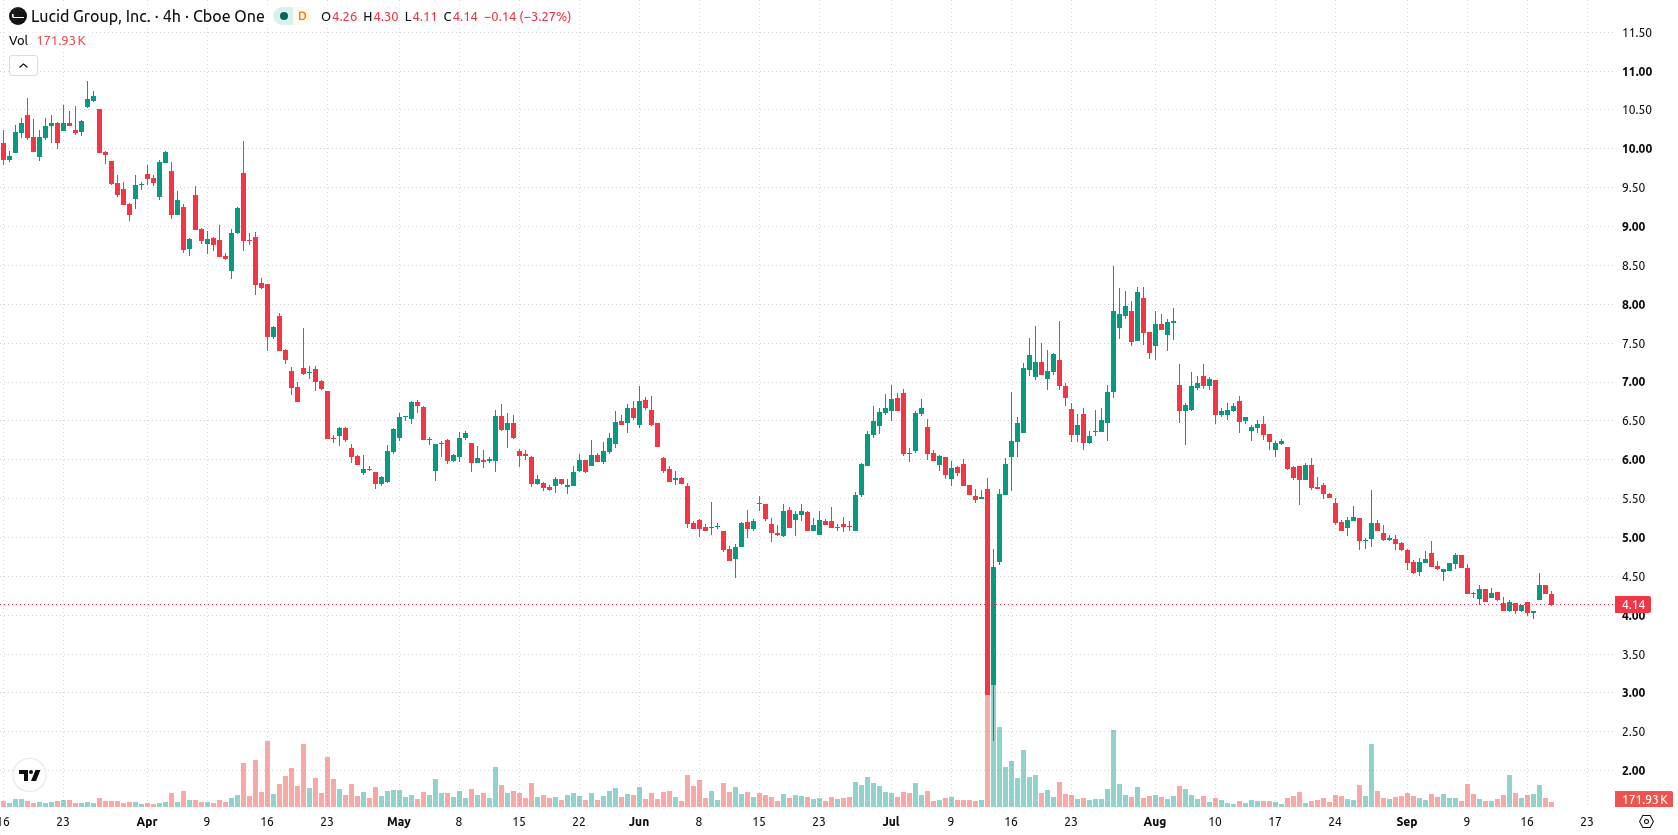
Lucid Group, Inc. (LCID) fell 3.5% as ongoing selling pressure outweighed recent positive developments, including a new partnership with Bolt. The downtrend is reinforced by the stock remaining well below its 20-, 50-, and 200-day moving averages, highlighting sustained weakness.
 3.18
3.59
Highlights
- Lucid Group will deploy at least 25,000 autonomous vehicles with Bolt in major European cities through a new strategic partnership.
- Lucid has finished a restructuring process with AlixPartners aimed at $1.4 billion in cash flow improvements and operational efficiency.
- Shares of Lucid traded near $4.13 with sustained downside pressure, a projected range of $3.82 to $4.43, and technical signals favoring further declines.
Expansion into European robotaxi market fails to lift bearish sentiment
Lucid Group announced a strategic partnership with European ride-hailing platform Bolt to deploy at least 25,000 autonomous vehicles across major European cities. The company also completed a restructuring process with advisor AlixPartners, targeting $1.4 billion in cash flow improvements and streamlining operations toward profitability. Both developments were disclosed as Lucid expands into the European robotaxi market and collaborates with local partners to meet regional requirements, though price action has remained under broader selling pressure.
Persistent downside momentum as stock tests lower technical boundaries
Lucid Group is trading below the 20-day moving average ($4.69), the 50-day moving average ($5.87), and the 200-day moving average ($8.13). This alignment signals sustained downside pressure across short-, medium-, and long-term trends, further confirmed by a bearish tilt on the 50- vs 200-day configuration. The nearest technical ceiling is at $4.2, coinciding with today's low, while the near-term floor stands at $3.94, set by the week’s low. Momentum gauges reflect continued weakness, with the Moving Average Convergence Divergence (MACD) and Average Directional Index (ADX) both forecasting sell signals. The Relative Strength Index (RSI) reads 34.63, edging near oversold territory, while the Stochastic RSI at 87.82 suggests short-term overbought conditions, and the Commodity Channel Index (CCI) is also in sell mode. Bull/Bear Power (BBP) is slightly positive at 0.07, indicating modest buyer dominance intraday. The Awesome Oscillator remains neutral. The stock is trading at $4.13, down $0.15 or 3.5% on the day after a downside gap of approximately 1.87%. It is positioned near the session’s low, with intraday volatility standing at 8.33%. Action since the open reflects persistent selling pressure with divergences among oscillators, suggesting indecision as momentum and overbought signals conflict.
Earlier, analysts noted that Lucid Group's strategic partnerships and restructuring initiatives were beginning to shift technical momentum, though challenges remained. The current analysis signals that downside risks now dominate, with traders advised to monitor $3.94 as the pivotal support level in the near term.










-
 Afghanistan
-
 Albania
-
 Algeria
-
 Angola
-
 Argentina
-
 Armenia
-
 Australia
-
 Austria
-
 Azerbaijan
-
 Bahamas
-
 Bahrain
-
 Bangladesh
-
 Belarus
-
 Belgium
-
 Bolivia
-
 Botswana
-
 Brazil
-
 Brunei
-
 Bulgaria
-
 Cambodia
-
 Cameroon
-
 Canada
-
 Chile
-
 China
-
 Colombia
-
 Congo
-
 Costa Rica
-
 Cote d'Ivoire
-
 Croatia
-
 Cuba
-
 Cyprus
-
 Czechia
-
 DR Congo
-
 Denmark
-
 Dominican Republic
-
 Ecuador
-
 Egypt
-
 El Salvador
-
 Estonia
-
 Eswatini
-
 Ethiopia
-
 Finland
-
 France
-
 Georgia
-
 Germany
-
 Ghana
-
 Greece
-
 Haiti
-
 Hong Kong
-
 Hungary
-
 India
-
 Indonesia
-
 Iran, Islamic republic
-
 Iraq
-
 Ireland
-
 Israel
-
 Italy
-
 Jamaica
-
 Japan
-
 Jordan
-
 Kazakhstan
-
 Kenya
-
 Korea
-
 Kuwait
-
 Kyrgyzstan
-
 Laos
-
 Latvia
-
 Lebanon
-
 Lesotho
-
 Libya
-
 Lithuania
-
 Luxembourg
-
 Madagascar
-
 Malaysia
-
 Malta
-
 Mauritius
-
 Mexico
-
 Moldova
-
 Mongolia
-
 Montenegro
-
 Morocco
-
 Mozambique
-
 Myanmar
-
 Namibia
-
 Nepal
-
 Netherlands
-
 New Zealand
-
 Nigeria
-
 North Macedonia
-
 Norway
-
 Oman
-
 Pakistan
-
 Palestine
-
 Panama
-
 Papua New Guinea
-
 Paraguay
-
 Peru
-
 Philippines
-
 Poland
-
 Portugal
-
 Puerto Rico
-
 Qatar
-
 Reunion
-
 Romania
-
 Rwanda
-
 Saudi Arabia
-
 Serbia
-
 Singapore
-
 Slovakia
-
 Slovenia
-
 Somalia
-
 South Africa
-
 Spain
-
 Sri Lanka
-
 Sweden
-
 Switzerland
-
 Syria
-
 Taiwan
-
 Tajikistan
-
 Tanzania
-
 Thailand
-
 Trinidad and Tobago
-
 Tunisia
-
 Turkey
-
 UAE
-
 Uganda
-
 Ukraine
-
 United Kingdom
-
United States
-
 Uruguay
-
 Uzbekistan
-
 Venezuela
-
 Vietnam
-
 Yemen
-
 Zambia
-
 Zimbabwe
- Forex
- Crypto












