

Steel Dynamics stock trades near $224.61 support after Q3 2026 earnings guidance announced

Steel Dynamics (STLD) stock is trading at $234.17 after declining 4.56% on the day. The price remains below its key short- and medium-term moving averages but continues to hold above longer-term averages, reflecting a mixed technical stance.
 248.78
Highlights
- Steel Dynamics issued third quarter 2026 earnings guidance of $5.34 to $5.38 per diluted share, setting profit expectations.
- The board declared a third quarter 2026 cash dividend of $0.53 per share, maintaining shareholder capital returns.
- Shares of Steel Dynamics closed at $234.17, falling 4.56% as technical indicators confirm dominant short-term selling pressure within a $224.61 to $240.04 trading range.
Earnings outlook and dividend policy reinforce sentiment amid selling
Steel Dynamics issued third quarter 2026 earnings guidance in the range of $5.34 to $5.38 per diluted share, establishing its near-term profit outlook and informing investor sentiment, according to PR Newswire. This forward guidance updates market positioning on anticipated earnings and has shaped expectations for upcoming fundamentals. Additionally, the board declared a third quarter 2026 cash dividend of $0.53 per share, according to PR Newswire, maintaining the company’s ongoing capital return to shareholders. Both developments reflect underlying operational momentum, though price action has remained under broader selling pressure.
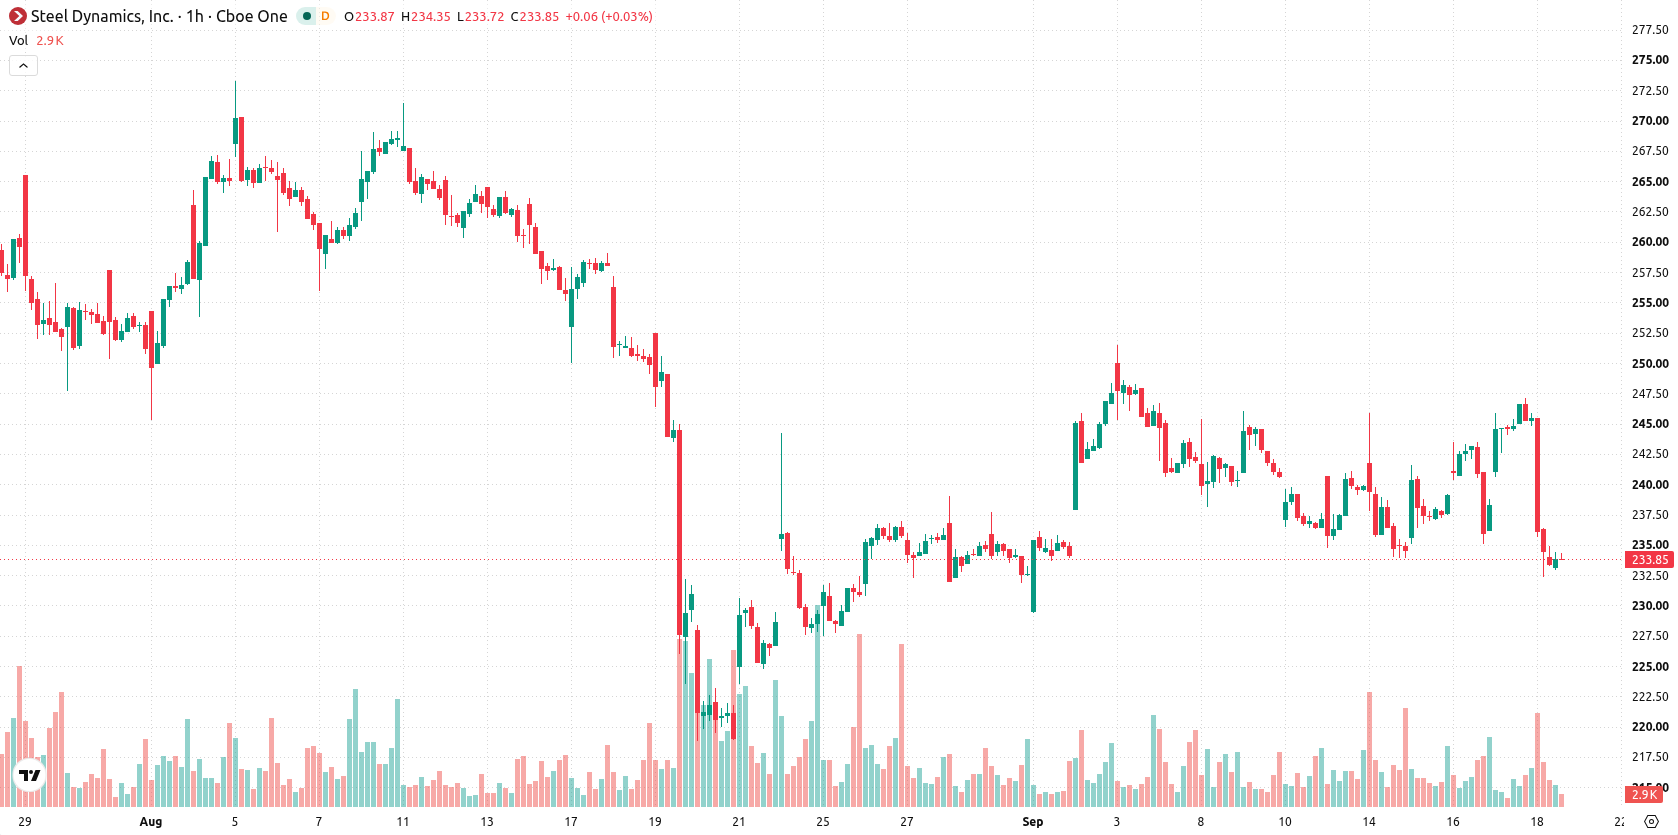
Intraday downside momentum as oversold signals and volatility intensify
STLD is trading below the MA-20 and MA-50 on the hourly chart, while remaining above the MA-200 on the daily timeframe. The Ichimoku Kijun at $239.93 serves as immediate resistance. Momentum signals are mixed, with both the MACD and Awesome Oscillator showing neutral readings, while ADX indicates a sell. The RSI sits at a low 35.83, and Stoch RSI, CCI, and Bull/Bear Power all register as oversold or in sell territory, confirming seller dominance in the intraday session. The price closed near today's low, accompanied by high volatility, as oscillators and momentum indicators continue to signal strong downside pressure without a clear reversal signal.
Sideways trading likely as risks remain skewed to downside
Over the next several sessions, the expected trading range is $224.61 to $240.04, reflecting typical volatility around current levels. There is a 75% probability of further downside, while the chance of a recovery is estimated at 25%. The baseline scenario envisions the price moving sideways within this band. A decisive move above $239.93 would signal potential recovery, while a drop below $224.61 could accelerate further losses.
Earlier, analysts noted that Steel Dynamics was facing mixed technical and momentum signals despite solid fundamentals and continued capital returns. The current technical setup continues to reinforce this cautious stance, with traders advised to monitor $239.93 as a key resistance level that could indicate a shift in direction if decisively breached.





Latest Steel Dynamics Inc News




-
 Afghanistan
-
 Albania
-
 Algeria
-
 Angola
-
 Argentina
-
 Armenia
-
 Australia
-
 Austria
-
 Azerbaijan
-
 Bahamas
-
 Bahrain
-
 Bangladesh
-
 Belarus
-
 Belgium
-
 Bolivia
-
 Botswana
-
 Brazil
-
 Brunei
-
 Bulgaria
-
 Cambodia
-
 Cameroon
-
 Canada
-
 Chile
-
 China
-
 Colombia
-
 Congo
-
 Costa Rica
-
 Cote d'Ivoire
-
 Croatia
-
 Cuba
-
 Cyprus
-
 Czechia
-
 DR Congo
-
 Denmark
-
 Dominican Republic
-
 Ecuador
-
 Egypt
-
 El Salvador
-
 Estonia
-
 Eswatini
-
 Ethiopia
-
 Finland
-
 France
-
 Georgia
-
 Germany
-
 Ghana
-
 Greece
-
 Haiti
-
 Hong Kong
-
 Hungary
-
 India
-
 Indonesia
-
 Iran, Islamic republic
-
 Iraq
-
 Ireland
-
 Israel
-
 Italy
-
 Jamaica
-
 Japan
-
 Jordan
-
 Kazakhstan
-
 Kenya
-
 Korea
-
 Kuwait
-
 Kyrgyzstan
-
 Laos
-
 Latvia
-
 Lebanon
-
 Lesotho
-
 Libya
-
 Lithuania
-
 Luxembourg
-
 Madagascar
-
 Malaysia
-
 Malta
-
 Mauritius
-
 Mexico
-
 Moldova
-
 Mongolia
-
 Montenegro
-
 Morocco
-
 Mozambique
-
 Myanmar
-
 Namibia
-
 Nepal
-
 Netherlands
-
 New Zealand
-
 Nigeria
-
 North Macedonia
-
 Norway
-
 Oman
-
 Pakistan
-
 Palestine
-
 Panama
-
 Papua New Guinea
-
 Paraguay
-
 Peru
-
 Philippines
-
 Poland
-
 Portugal
-
 Puerto Rico
-
 Qatar
-
 Reunion
-
 Romania
-
 Rwanda
-
 Saudi Arabia
-
 Serbia
-
 Singapore
-
 Slovakia
-
 Slovenia
-
 Somalia
-
 South Africa
-
 Spain
-
 Sri Lanka
-
 Sweden
-
 Switzerland
-
 Syria
-
 Taiwan
-
 Tajikistan
-
 Tanzania
-
 Thailand
-
 Trinidad and Tobago
-
 Tunisia
-
 Turkey
-
 UAE
-
 Uganda
-
 Ukraine
-
 United Kingdom
-
United States
-
 Uruguay
-
 Uzbekistan
-
 Venezuela
-
 Vietnam
-
 Yemen
-
 Zambia
-
 Zimbabwe
- Forex
- Crypto












