

Steel Dynamics shares drop almost 5% after weaker-than-expected third quarter outlook and technical selling pressure

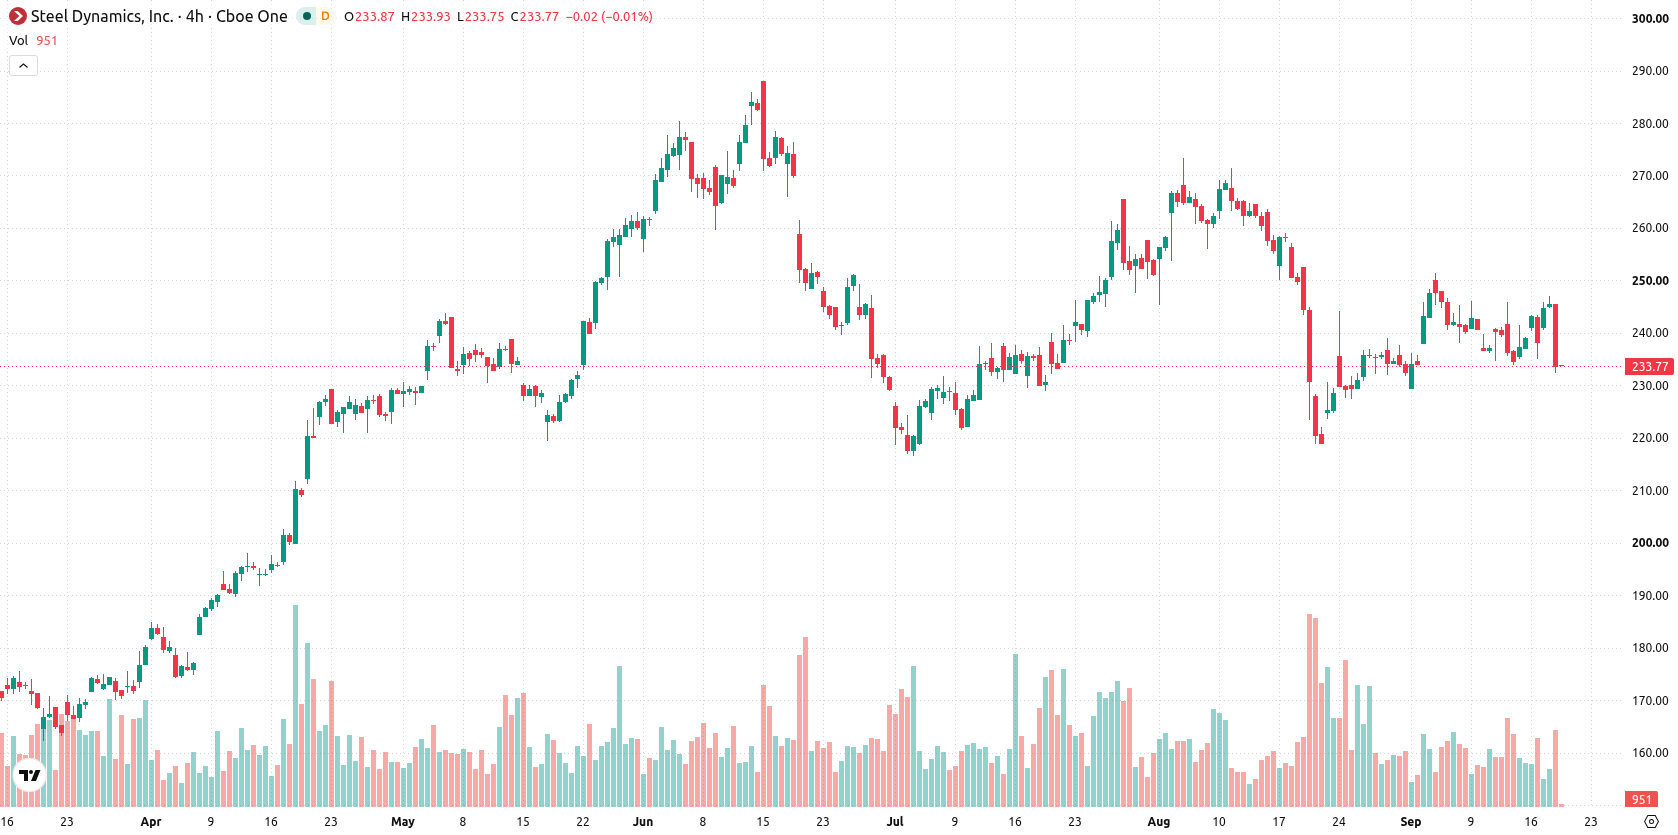
Steel Dynamics Inc (STLD) fell 4.74% as the company's third quarter 2026 earnings guidance came in below market consensus, even as buyback activity and higher projected margins offered a supportive backdrop. The down move is supported by short- and medium-term pressure below the 20-day and 50-day moving averages.
 253.21
253.99
Highlights
- Steel Dynamics projects third quarter 2026 earnings of $5.34 to $5.38 per diluted share, higher than previous periods.
- Higher steel margins, record shipments, increased selling prices, and lower scrap costs drove the improved outlook, while $261 million in stock was repurchased and a $0.53 dividend declared.
- Shares of Steel Dynamics are trading below short- and medium-term averages with continued selling pressure and forecast for sideways movement between $221.93 and $240.29 over the next five trading days.
Positive earnings outlook meets persistent selling despite capital returns
Steel Dynamics reported third quarter 2026 earnings guidance of $5.34 to $5.38 per diluted share, an increase over the prior quarter and year-ago period. This projection was attributed to higher steel margins, record shipments, increased average selling prices, and lower scrap costs. The company repurchased $261 million in stock during the quarter and declared a cash dividend of $0.53 per share, with an ex-dividend date of September 30, 2026 and payment on October 19, 2026, though price action has remained under broader selling pressure.
Mixed momentum and overbought signals amid short-term technical pressure
Steel Dynamics is trading below its 20-day and 50-day moving averages ($236.61 and $243.53, respectively), indicating short- and medium-term pressure from sellers, but remains above the longer-term 200-day moving average at $213.48. Immediate technical levels show a near-term floor at $232.33 and a ceiling at $233.98, with trend confirmation from the bullish alignment of the 50-day versus the 200-day moving average. Momentum signals are mixed: the Moving Average Convergence Divergence (MACD) shows a strong sell signal, while the Average Directional Index (ADX) reads neutral. The Relative Strength Index (RSI) is at 53.78, leaning toward a buy, yet both the Stochastic RSI and Commodity Channel Index (CCI) indicate heavy overbought conditions, echoed by Bull/Bear Power (BBP) at 7.16, which reflects buyer dominance and an overbought market. The stock opened with a modest downside gap of $0.37 (0.15%), has moved down $11.62 or 4.74% on the day, and is trading near session lows with intraday volatility standing at 5.44%. This suggests sustained selling pressure and heightened churn after the open. There is notable divergence among oscillators, with intraday performance aligning more with bearish momentum signals.
Earlier, analysts noted that Steel Dynamics was maintaining strong technical momentum based on solid fundamentals and capital return policies. The current shift to mixed momentum signals and heightened downside volatility introduces a more cautious outlook, with traders advised to monitor $232.33 as a pivotal near-term support to gauge further direction.






Latest Steel Dynamics Inc News




-
 Afghanistan
-
 Albania
-
 Algeria
-
 Angola
-
 Argentina
-
 Armenia
-
 Australia
-
 Austria
-
 Azerbaijan
-
 Bahamas
-
 Bahrain
-
 Bangladesh
-
 Belarus
-
 Belgium
-
 Bolivia
-
 Botswana
-
 Brazil
-
 Brunei
-
 Bulgaria
-
 Cambodia
-
 Cameroon
-
 Canada
-
 Chile
-
 China
-
 Colombia
-
 Congo
-
 Costa Rica
-
 Cote d'Ivoire
-
 Croatia
-
 Cuba
-
 Cyprus
-
 Czechia
-
 DR Congo
-
 Denmark
-
 Dominican Republic
-
 Ecuador
-
 Egypt
-
 El Salvador
-
 Estonia
-
 Eswatini
-
 Ethiopia
-
 Finland
-
 France
-
 Georgia
-
 Germany
-
 Ghana
-
 Greece
-
 Haiti
-
 Hong Kong
-
 Hungary
-
 India
-
 Indonesia
-
 Iran, Islamic republic
-
 Iraq
-
 Ireland
-
 Israel
-
 Italy
-
 Jamaica
-
 Japan
-
 Jordan
-
 Kazakhstan
-
 Kenya
-
 Korea
-
 Kuwait
-
 Kyrgyzstan
-
 Laos
-
 Latvia
-
 Lebanon
-
 Lesotho
-
 Libya
-
 Lithuania
-
 Luxembourg
-
 Madagascar
-
 Malaysia
-
 Malta
-
 Mauritius
-
 Mexico
-
 Moldova
-
 Mongolia
-
 Montenegro
-
 Morocco
-
 Mozambique
-
 Myanmar
-
 Namibia
-
 Nepal
-
 Netherlands
-
 New Zealand
-
 Nigeria
-
 North Macedonia
-
 Norway
-
 Oman
-
 Pakistan
-
 Palestine
-
 Panama
-
 Papua New Guinea
-
 Paraguay
-
 Peru
-
 Philippines
-
 Poland
-
 Portugal
-
 Puerto Rico
-
 Qatar
-
 Reunion
-
 Romania
-
 Rwanda
-
 Saudi Arabia
-
 Serbia
-
 Singapore
-
 Slovakia
-
 Slovenia
-
 Somalia
-
 South Africa
-
 Spain
-
 Sri Lanka
-
 Sweden
-
 Switzerland
-
 Syria
-
 Taiwan
-
 Tajikistan
-
 Tanzania
-
 Thailand
-
 Trinidad and Tobago
-
 Tunisia
-
 Turkey
-
 UAE
-
 Uganda
-
 Ukraine
-
 United Kingdom
-
United States
-
 Uruguay
-
 Uzbekistan
-
 Venezuela
-
 Vietnam
-
 Yemen
-
 Zambia
-
 Zimbabwe
- Forex
- Crypto












