

Support test at $37.91: Can BROS avoid deeper losses?

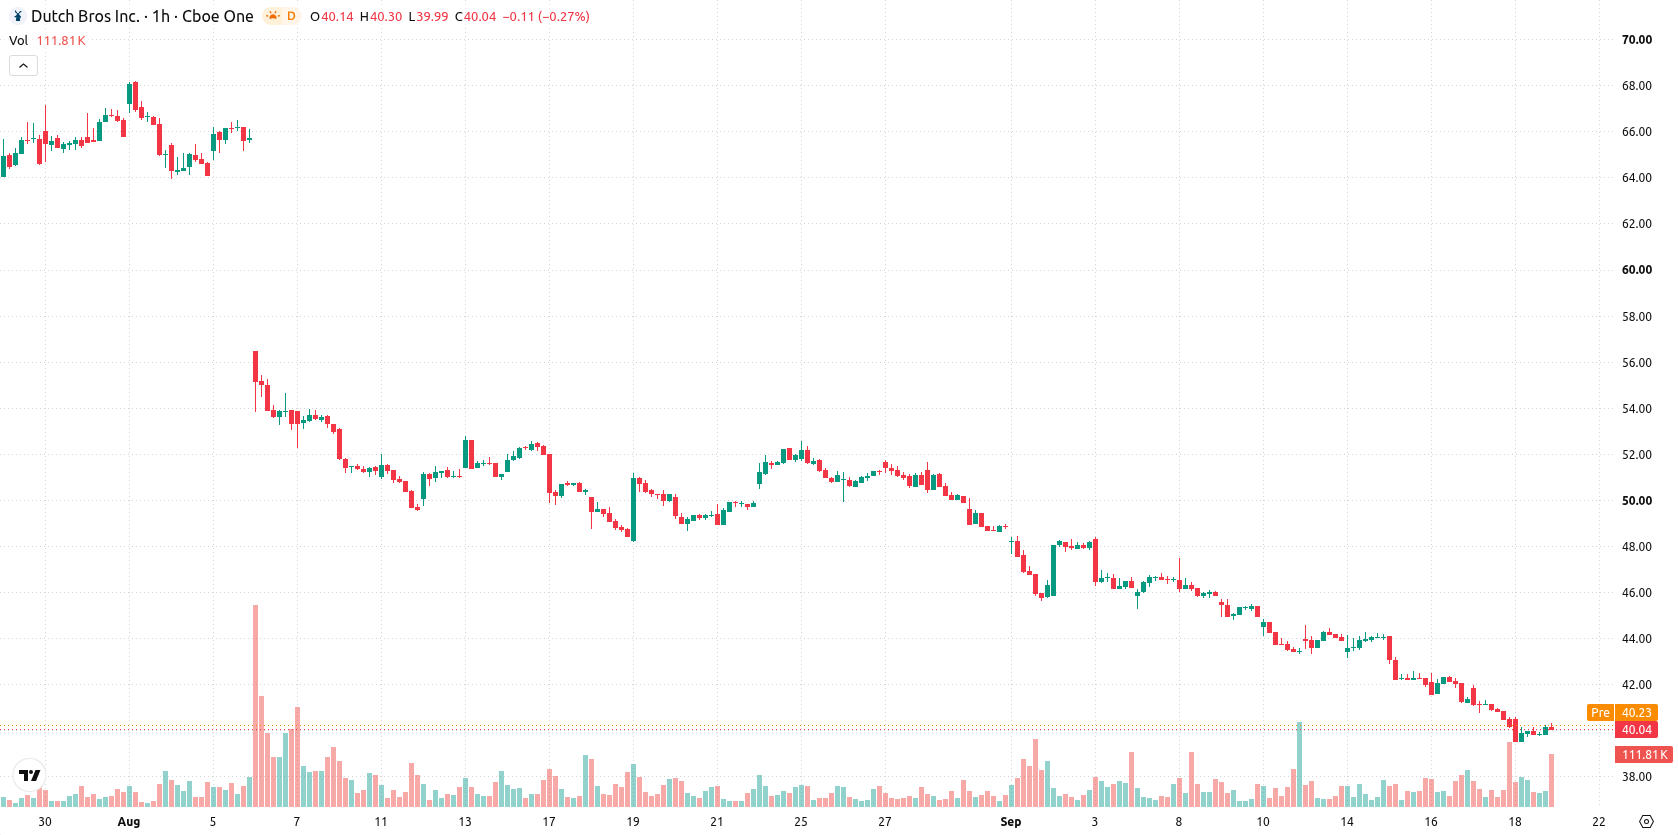
Dutch Bros Inc. (BROS) stock is trading at $40.03, slipping marginally today. The price currently sits below its key moving averages, reflecting ongoing weakness in the near term.
 38.18
40.06
38.18
40.06
Highlights
- BROS/USD trades below key moving averages across all timeframes, confirming sustained downward pressure on the stock.
- Momentum indicators such as MACD, ADX, RSI, and CCI collectively show strong sell signals, though Stoch RSI diverges with an overbought reading.
- Expected price range for the next several sessions is $37.91 to $42.15, with high probability for a move lower unless price reclaims resistance at $41.04.
Multiple indicators confirm persistent selling amid resistance tests
On the hourly chart, BROS/USD trades below MA-20 at $40.81, MA-50 at $42.42, and remains under the long-term MA-200 at $56.65. The Ichimoku Kijun at $41.04 sets immediate resistance. MACD signals strong sell conditions, with ADX confirming a selling environment. RSI posts 31.18, which, alongside CCI, is in sell territory. Stoch RSI diverges, showing overbought, while Bull/Bear Power suggests continued seller dominance on the intraday level. Awesome Oscillator is neutral and does not reinforce the prevailing trend.
Downside risk prevails as breakout probability stays low
For the next several sessions, BROS is expected to trade in the $37.91 to $42.15 range, reflecting typical volatility for the current context. The probability of a move higher remains very low, while a move below $37.91 carries a very high probability. The base-case scenario favors range-bound activity between support and resistance. A bullish scenario would require a breakout above $41.04, whereas a close beneath $37.91 would likely trigger further declines.
Earlier, analysts noted that Dutch Bros stock was entrenched in a bearish technical setup, with downside risks dominating the outlook. The current analysis confirms this prevailing weakness, with traders now watching for sustained momentum below $37.91 as a signal for further declines.





Latest Dutch Bros News





-
 Afghanistan
-
 Albania
-
 Algeria
-
 Angola
-
 Argentina
-
 Armenia
-
 Australia
-
 Austria
-
 Azerbaijan
-
 Bahamas
-
 Bahrain
-
 Bangladesh
-
 Belarus
-
 Belgium
-
 Bolivia
-
 Botswana
-
 Brazil
-
 Brunei
-
 Bulgaria
-
 Cambodia
-
 Cameroon
-
 Canada
-
 Chile
Chile
-
 China
China
-
 Colombia
-
 Congo
Congo
-
 Costa Rica
-
 Cote d'Ivoire
-
 Croatia
-
 Cuba
Cuba
-
 Cyprus
-
 Czechia
-
 DR Congo
-
 Denmark
-
 Dominican Republic
-
 Ecuador
-
 Egypt
Egypt
-
 El Salvador
-
 Estonia
-
 Eswatini
-
 Ethiopia
-
 Finland
-
 France
-
 Georgia
-
 Germany
-
 Ghana
Ghana
-
 Greece
-
 Haiti
Haiti
-
 Hong Kong
-
 Hungary
-
 India
India
-
 Indonesia
-
 Iran, Islamic republic
-
 Iraq
Iraq
-
 Ireland
-
 Israel
-
 Italy
Italy
-
 Jamaica
-
 Japan
Japan
-
 Jordan
-
 Kazakhstan
-
 Kenya
Kenya
-
 Korea
Korea
-
 Kuwait
-
 Kyrgyzstan
-
 Laos
Laos
-
 Latvia
-
 Lebanon
-
 Lesotho
-
 Libya
Libya
-
 Lithuania
-
 Luxembourg
-
 Madagascar
-
 Malaysia
-
 Malta
Malta
-
 Mauritius
-
 Mexico
-
 Moldova
-
 Mongolia
-
 Montenegro
-
 Morocco
-
 Mozambique
-
 Myanmar
-
 Namibia
-
 Nepal
Nepal
-
 Netherlands
-
 New Zealand
-
 Nigeria
-
 North Macedonia
-
 Norway
-
 Oman
Oman
-
 Pakistan
-
 Palestine
-
 Panama
-
 Papua New Guinea
-
 Paraguay
-
 Peru
Peru
-
 Philippines
-
 Poland
-
 Portugal
-
 Puerto Rico
-
 Qatar
Qatar
-
 Reunion
-
 Romania
-
 Rwanda
-
 Saudi Arabia
-
 Serbia
-
 Singapore
-
 Slovakia
-
 Slovenia
-
 Somalia
-
 South Africa
-
 Spain
Spain
-
 Sri Lanka
-
 Sweden
-
 Switzerland
-
 Syria
Syria
-
 Taiwan
-
 Tajikistan
-
 Tanzania
-
 Thailand
-
 Trinidad and Tobago
-
 Tunisia
-
 Turkey
-
 UAE
UAE
-
 Uganda
-
 Ukraine
-
 United Kingdom
-
United States
-
 Uruguay
-
 Uzbekistan
-
 Venezuela
-
 Vietnam
-
 Yemen
Yemen
-
 Zambia
-
 Zimbabwe
- Forex
- Crypto












