

Oracle stock buyers fail to confirm breakout as price stalls below 20-day resistance: weekly analysis

Shares of Oracle Corporation (ORCL) are trading near $148 as the chart shows buyers struggling to maintain momentum after a failed breakout attempt. Conflicting technical signals and muted volatility highlight an indecisive setup for the coming week, keeping traders alert for confirmation in either direction.
 133.56
148.40
Highlights
- Shares of Oracle fell slightly to $147.54 over the past week and are trading below key long-term moving averages.
- Technical indicators are mixed with a strong buy signal from MACD, but overbought conditions and lack of positive momentum suggest indecision.
- Oracle stock is expected to consolidate between $142.21 and $153.39 over the next five days, with 71% probability of a decrease.
Cloud revenue surge and security updates drive bullish sentiment this week
Oracle reported a 30% jump in fiscal first-quarter revenue, highlighted by a 121% surge in cloud infrastructure revenue and a backlog of $664 billion, according to Yahoo Finance. The company maintained its quarterly dividend at $0.50 per share for October 23, 2026, as noted by Pluang, and reaffirmed progress on its Project Jupiter data center in New Mexico. Meanwhile, a critical security update was released in September 2026 with patches for 673 vulnerabilities, according to Cyber Security News.
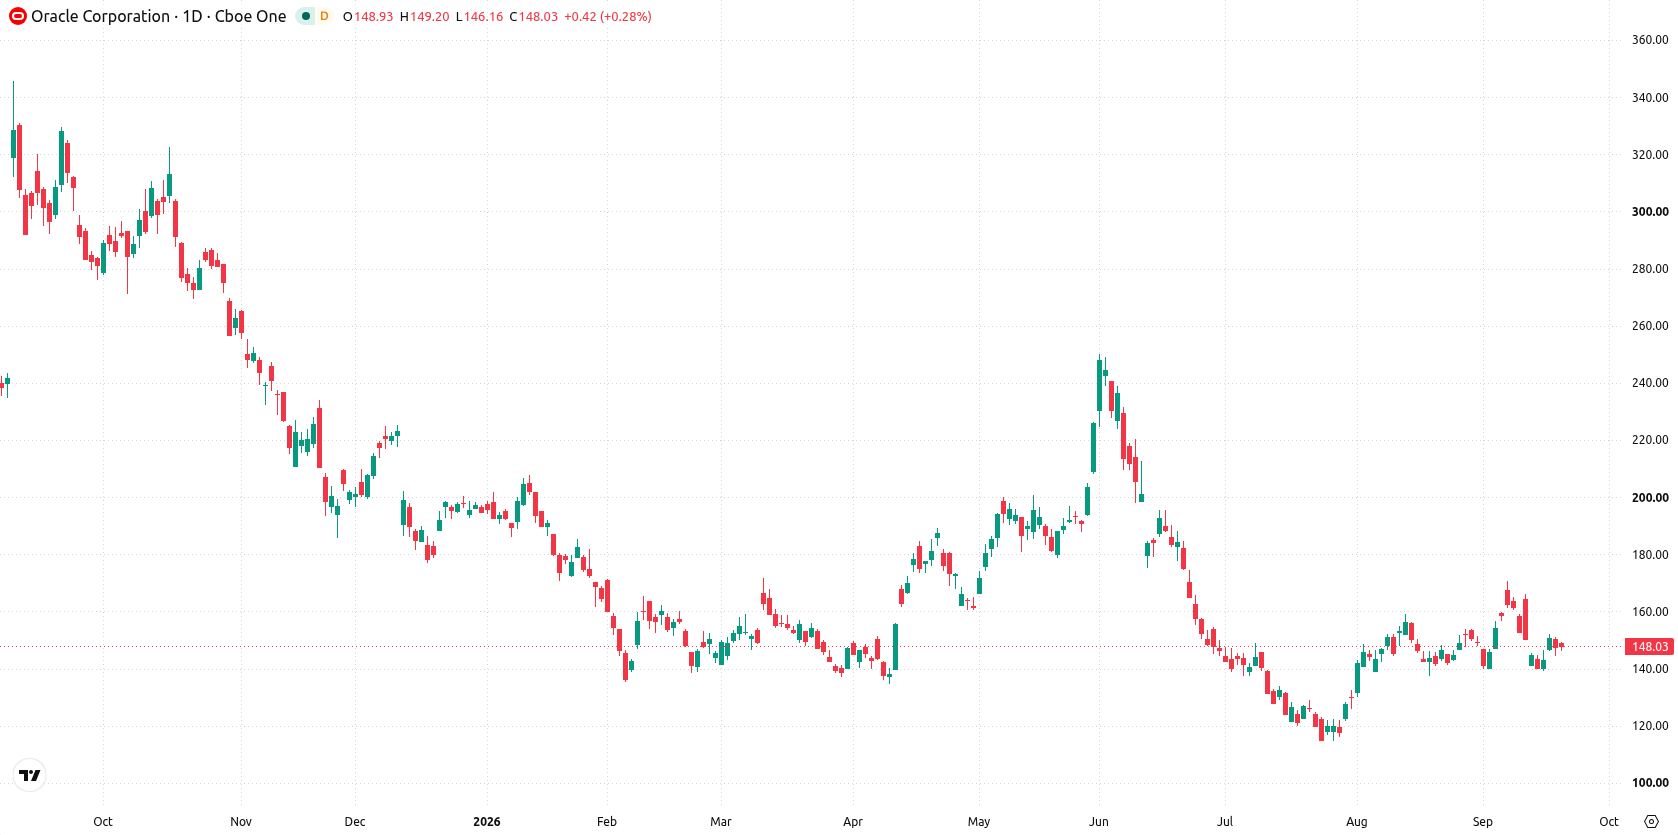
Mixed momentum emerges as volatility persists in a consolidating weekly range
On the daily chart, Oracle stock shows a flat trend after a sharp move lower without a sustained trend, amid 8.5% volatility. The MACD gives a Strong Buy reading (0.35), but this is at odds with Bull/Bear Power in the overbought zone (1.73), highlighting mixed momentum signals. Immediate resistance is marked by the 20-day average at $149.37, with additional resistance at the Ichimoku Kijun of $152.05, while key support stands at the 50-day average of $140.99. Price action is consolidating in the upper part of the weekly range, suggesting the setup remains indecisive.
Consolidation likely to persist unless resistance breaks in the coming week
Over the next five trading days, Oracle is expected to trade between $142.21 and $153.39. The probability of a decrease stands at 71%, with a 29% chance of an increase. The base case is further consolidation within this band. A bullish breakout above resistance at $149.37 could open a test of $152.05, while a sustained move below support at $140.99 would reinforce the bearish outlook.
Earlier, analysts noted that Oracle was entering a consolidation phase underpinned by mixed technical signals and ongoing restructuring focused on AI and cloud infrastructure expansion. The current setup adds further weight to this view, with traders advised to monitor the 20-day average resistance at $149.37 and 50-day average support at $140.99 as pivotal levels for directional confirmation in the sessions ahead.









-
 Afghanistan
-
 Albania
-
 Algeria
-
 Angola
-
 Argentina
-
 Armenia
-
 Australia
-
 Austria
-
 Azerbaijan
-
 Bahamas
-
 Bahrain
-
 Bangladesh
-
 Belarus
-
 Belgium
-
 Bolivia
-
 Botswana
-
 Brazil
-
 Brunei
-
 Bulgaria
-
 Cambodia
-
 Cameroon
-
 Canada
-
 Chile
-
 China
-
 Colombia
-
 Congo
-
 Costa Rica
-
 Cote d'Ivoire
-
 Croatia
-
 Cuba
-
 Cyprus
-
 Czechia
-
 DR Congo
-
 Denmark
-
 Dominican Republic
-
 Ecuador
-
 Egypt
-
 El Salvador
-
 Estonia
-
 Eswatini
-
 Ethiopia
-
 Finland
-
 France
-
 Georgia
-
 Germany
-
 Ghana
-
 Greece
-
 Haiti
-
 Hong Kong
-
 Hungary
-
 India
-
 Indonesia
-
 Iran, Islamic republic
-
 Iraq
-
 Ireland
-
 Israel
-
 Italy
-
 Jamaica
-
 Japan
-
 Jordan
-
 Kazakhstan
-
 Kenya
-
 Korea
-
 Kuwait
-
 Kyrgyzstan
-
 Laos
-
 Latvia
-
 Lebanon
-
 Lesotho
-
 Libya
-
 Lithuania
-
 Luxembourg
-
 Madagascar
-
 Malaysia
-
 Malta
-
 Mauritius
-
 Mexico
-
 Moldova
-
 Mongolia
-
 Montenegro
-
 Morocco
-
 Mozambique
-
 Myanmar
-
 Namibia
-
 Nepal
-
 Netherlands
-
 New Zealand
-
 Nigeria
-
 North Macedonia
-
 Norway
-
 Oman
-
 Pakistan
-
 Palestine
-
 Panama
-
 Papua New Guinea
-
 Paraguay
-
 Peru
-
 Philippines
-
 Poland
-
 Portugal
-
 Puerto Rico
-
 Qatar
-
 Reunion
-
 Romania
-
 Rwanda
-
 Saudi Arabia
-
 Serbia
-
 Singapore
-
 Slovakia
-
 Slovenia
-
 Somalia
-
 South Africa
-
 Spain
-
 Sri Lanka
-
 Sweden
-
 Switzerland
-
 Syria
-
 Taiwan
-
 Tajikistan
-
 Tanzania
-
 Thailand
-
 Trinidad and Tobago
-
 Tunisia
-
 Turkey
-
 UAE
-
 Uganda
-
 Ukraine
-
 United Kingdom
-
United States
-
 Uruguay
-
 Uzbekistan
-
 Venezuela
-
 Vietnam
-
 Yemen
-
 Zambia
-
 Zimbabwe
- Forex
- Crypto












