

CrowdStrike stock rises as buyer support builds after recent rally

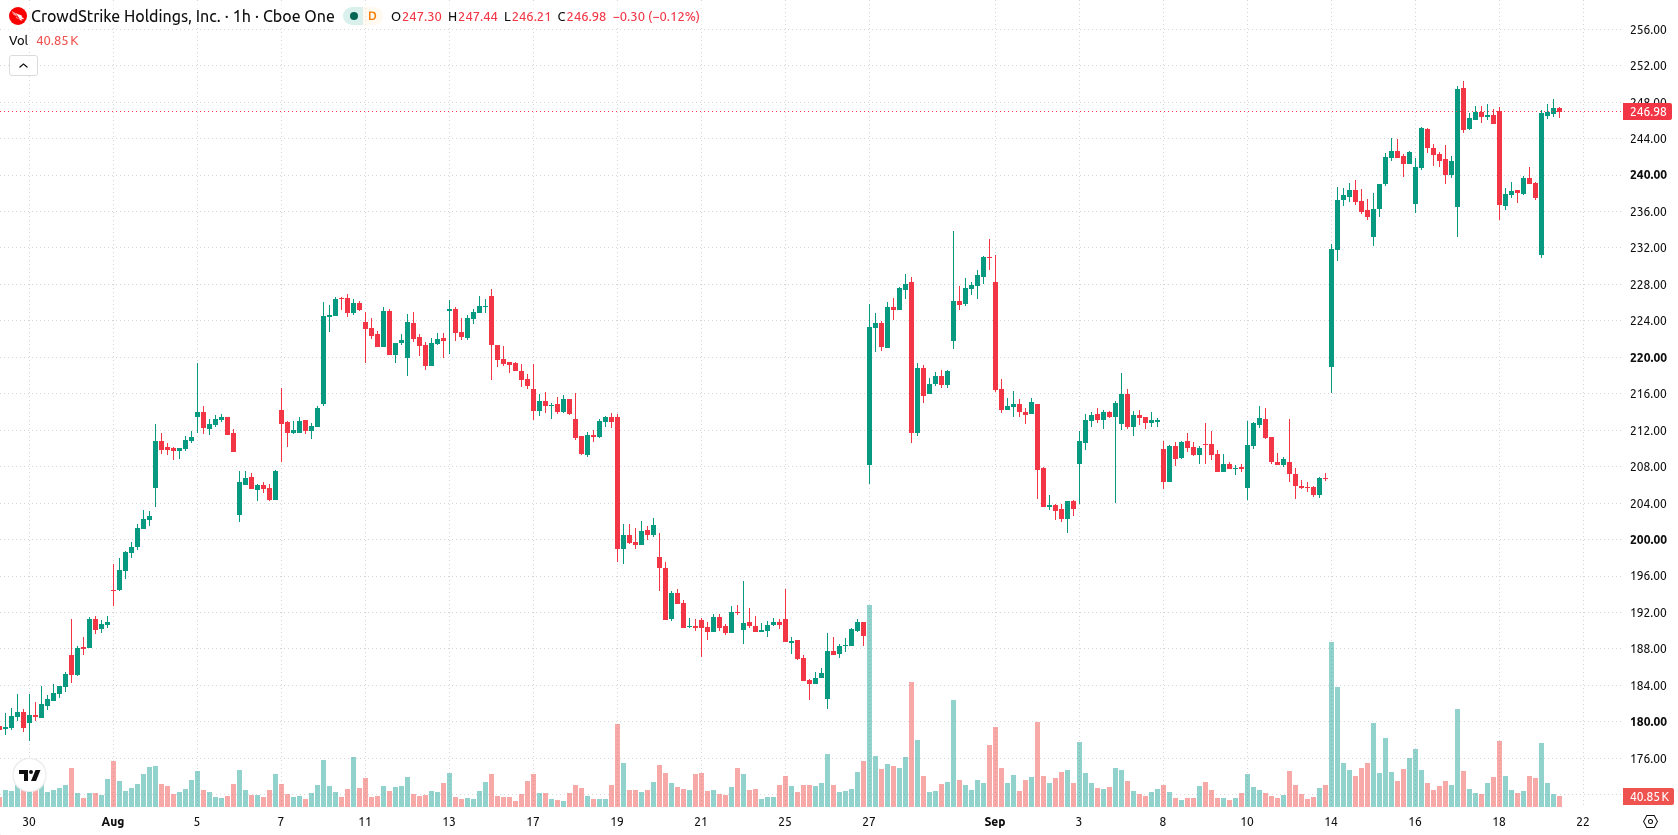
CrowdStrike (CRWD) stock is trading at $247.84, up 4.31% on the day. The price sits above its key moving averages, signaling strength relative to recent short- and long-term trends.
 256.18
269.30
Highlights
- CRWD/USD trades in a sustained bullish trend on short, medium, and long-term timeframes, confirmed by key moving averages.
- Momentum signals are mixed, with strong trend indicators but oscillators showing oversold conditions and seller dominance intraday.
- Price is expected to hold between $240.92 and $254.76 over several days, with high probability of upside and low downside risk.
Mixed momentum signals as technical supports cluster near current level
On the hourly timeframe, CRWD is positioned above the MA-20 at $242.37 and MA-50 at $231.77, both serving as near-term technical support, while the MA-200 at $146.96 marks a much lower long-term baseline. The Ichimoku Kijun level at $241.76 offers immediate structural support within the current range. Momentum indicators are mixed: MACD signals Strong Buy and ADX indicates a Buy, but RSI reads 47.55 (Sell) and CCI also issues a Sell signal. Stoch RSI and Bull/Bear Power reveal oversold conditions and note continued seller dominance over the intraday period. Awesome Oscillator is currently neutral, underscoring indecision among momentum signals despite high price volatility.
Consolidation likely unless resistance breaks to trigger bullish run
In the short term, CRWD is expected to trade within a typical volatility band of $240.92 to $254.76. There is a very high probability of continued upward movement, while downside risk is assessed as very low. The baseline outlook calls for the price to remain in a sideways consolidation, with a bullish scenario emerging if resistance at $254.76 is breached. A close below support at $240.92, however, could open the way for a bearish shift.
Earlier, analysts noted that CrowdStrike's strong uptrend was underpinned by sustained demand for AI-powered cybersecurity, though concerns remained regarding overextension and valuation. The current technical picture highlights mixed momentum signals and heightened volatility, making the upcoming test of $254.76 resistance a pivotal level for traders to monitor.






Latest CrowdStrike News



-
 Afghanistan
-
 Albania
-
 Algeria
-
 Angola
-
 Argentina
-
 Armenia
-
 Australia
-
 Austria
-
 Azerbaijan
-
 Bahamas
-
 Bahrain
-
 Bangladesh
-
 Belarus
-
 Belgium
-
 Bolivia
-
 Botswana
-
 Brazil
-
 Brunei
-
 Bulgaria
-
 Cambodia
-
 Cameroon
-
 Canada
-
 Chile
-
 China
-
 Colombia
-
 Congo
-
 Costa Rica
-
 Cote d'Ivoire
-
 Croatia
-
 Cuba
-
 Cyprus
-
 Czechia
-
 DR Congo
-
 Denmark
-
 Dominican Republic
-
 Ecuador
-
 Egypt
-
 El Salvador
-
 Estonia
-
 Eswatini
-
 Ethiopia
-
 Finland
-
 France
-
 Georgia
-
 Germany
-
 Ghana
-
 Greece
-
 Haiti
-
 Hong Kong
-
 Hungary
-
 India
-
 Indonesia
-
 Iran, Islamic republic
-
 Iraq
-
 Ireland
-
 Israel
-
 Italy
-
 Jamaica
-
 Japan
-
 Jordan
-
 Kazakhstan
-
 Kenya
-
 Korea
-
 Kuwait
-
 Kyrgyzstan
-
 Laos
-
 Latvia
-
 Lebanon
-
 Lesotho
-
 Libya
-
 Lithuania
-
 Luxembourg
-
 Madagascar
-
 Malaysia
-
 Malta
-
 Mauritius
-
 Mexico
-
 Moldova
-
 Mongolia
-
 Montenegro
-
 Morocco
-
 Mozambique
-
 Myanmar
-
 Namibia
-
 Nepal
-
 Netherlands
-
 New Zealand
-
 Nigeria
-
 North Macedonia
-
 Norway
-
 Oman
-
 Pakistan
-
 Palestine
-
 Panama
-
 Papua New Guinea
-
 Paraguay
-
 Peru
-
 Philippines
-
 Poland
-
 Portugal
-
 Puerto Rico
-
 Qatar
-
 Reunion
-
 Romania
-
 Rwanda
-
 Saudi Arabia
-
 Serbia
-
 Singapore
-
 Slovakia
-
 Slovenia
-
 Somalia
-
 South Africa
-
 Spain
-
 Sri Lanka
-
 Sweden
-
 Switzerland
-
 Syria
-
 Taiwan
-
 Tajikistan
-
 Tanzania
-
 Thailand
-
 Trinidad and Tobago
-
 Tunisia
-
 Turkey
-
 UAE
-
 Uganda
-
 Ukraine
-
 United Kingdom
-
United States
-
 Uruguay
-
 Uzbekistan
-
 Venezuela
-
 Vietnam
-
 Yemen
-
 Zambia
-
 Zimbabwe
- Forex
- Crypto












