


The TJX Companies, Inc. (TJX) surged 3.14% in a session dominated by technical momentum signals as buyers drove prices sharply higher. The advance looks limited, with TJX Companies still capped by its 50-day and 200-day moving averages despite intraday strength.
 135.63
138.03
Highlights
- Shares of TJX Companies trade just above the 20-day moving average, but remain below key longer-term averages.
- Momentum indicators including MACD, ADX, and RSI signal strong selling pressure, but intraday trades are near session highs.
- For the next five days, shares are expected to move between $127.96 to $134.58, with a high probability of a downward move.
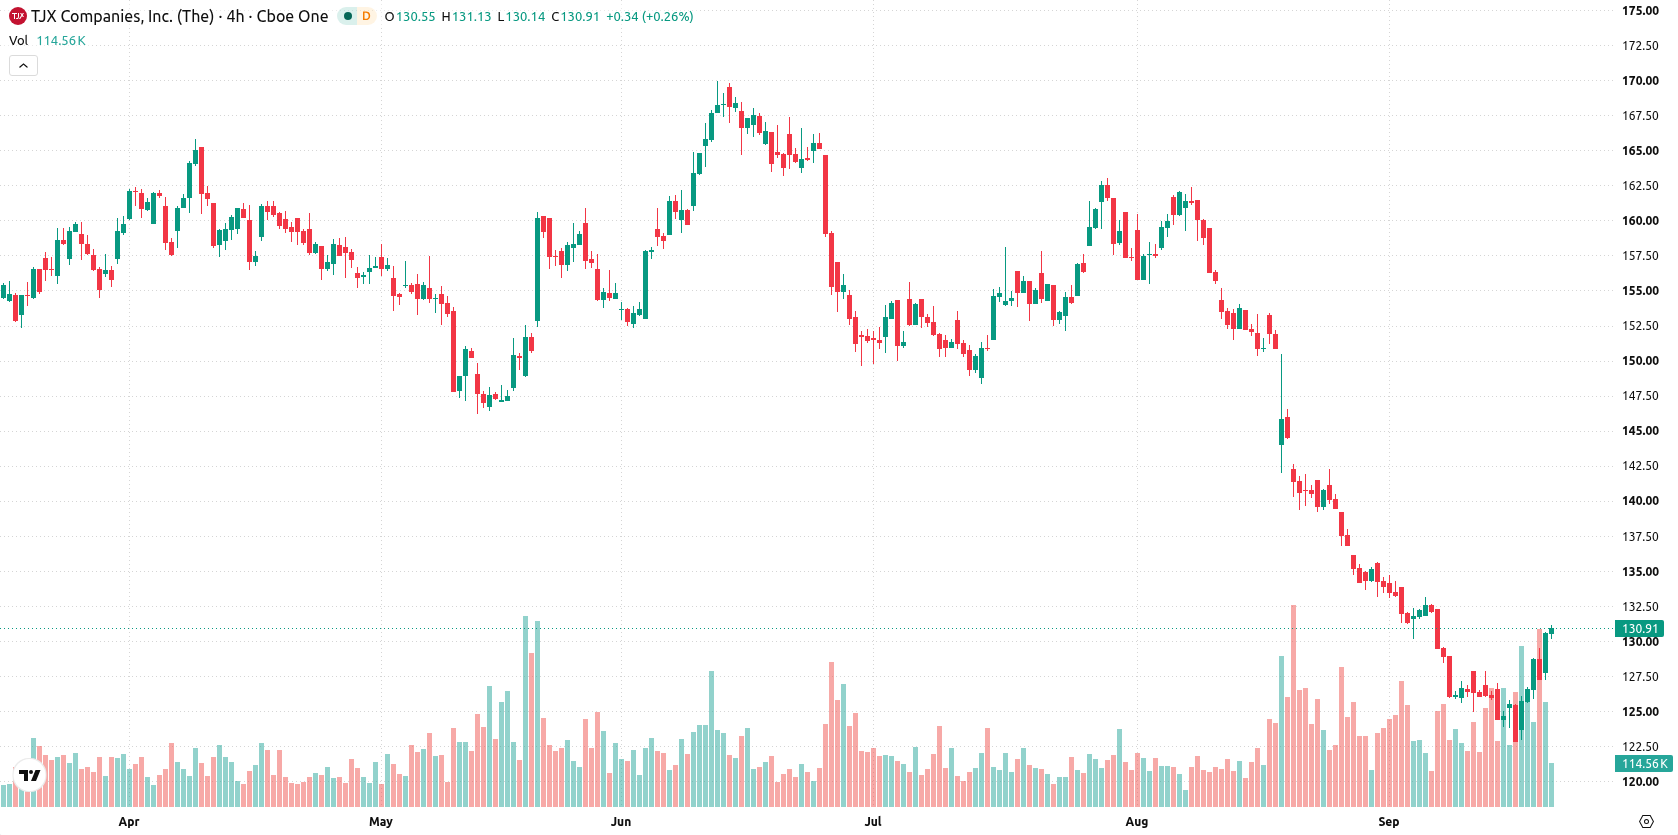
Short-term stabilization faces resistance amid bearish momentum
TJX Companies is trading just above its 20-day moving average at $131.23, but remains below both the 50-day ($145.29) and 200-day ($153.65) moving averages. This arrangement suggests short-term stabilization amid prolonged medium- and long-term pressure from sellers, with the near-term floor seen at $131.23 and overhead resistance at $134.58. Momentum signals from the MACD and ADX both indicate strong selling pressure, supported by bearish readings from the CCI and the RSI at 31.3. However, the Stochastic RSI registers 100, highlighting an overbought short-term condition. Bull/Bear Power (BBP) reads 0.71, showing buyers have dominated intraday momentum, but this is coupled with an 'Overbought' signal. The stock is up $4 or 3.14% with an upside gap of 0.36% from the previous close, holding near the top of its session at $131.27 as intraday volatility stands at 3.01%. The tone in today’s session leans toward persistent strength near the day’s highs, though momentum indicators mostly point to persistent downward pressure, demonstrating a divergence with the current price behavior.
Earlier, analysts noted that household spending trends have come under pressure, with consumers increasingly seeking value and trading down amid persistent inflation and weaker retail activity. TJX Companies’ current technical setup adds a new dimension to this narrative, as the prevailing scenario of sideways movement near $131 highlights the importance of monitoring the $127.96 support in the coming sessions for signs of renewed momentum or further downside risk.






Latest TJX Companies News





-
 Afghanistan
-
 Albania
-
 Algeria
-
 Angola
-
 Argentina
-
 Armenia
-
 Australia
-
 Austria
-
 Azerbaijan
-
 Bahamas
-
 Bahrain
-
 Bangladesh
-
 Belarus
-
 Belgium
-
 Bolivia
-
 Botswana
-
 Brazil
-
 Brunei
-
 Bulgaria
-
 Cambodia
-
 Cameroon
-
 Canada
-
 Chile
-
 China
-
 Colombia
-
 Congo
-
 Costa Rica
-
 Cote d'Ivoire
-
 Croatia
-
 Cuba
-
 Cyprus
-
 Czechia
-
 DR Congo
-
 Denmark
-
 Dominican Republic
-
 Ecuador
-
 Egypt
-
 El Salvador
-
 Estonia
-
 Eswatini
-
 Ethiopia
-
 Finland
-
 France
-
 Georgia
-
 Germany
-
 Ghana
-
 Greece
-
 Haiti
-
 Hong Kong
-
 Hungary
-
 India
-
 Indonesia
-
 Iran, Islamic republic
-
 Iraq
-
 Ireland
-
 Israel
-
 Italy
-
 Jamaica
-
 Japan
-
 Jordan
-
 Kazakhstan
-
 Kenya
-
 Korea
-
 Kuwait
-
 Kyrgyzstan
-
 Laos
-
 Latvia
-
 Lebanon
-
 Lesotho
-
 Libya
-
 Lithuania
-
 Luxembourg
-
 Madagascar
-
 Malaysia
-
 Malta
-
 Mauritius
-
 Mexico
-
 Moldova
-
 Mongolia
-
 Montenegro
-
 Morocco
-
 Mozambique
-
 Myanmar
-
 Namibia
-
 Nepal
-
 Netherlands
-
 New Zealand
-
 Nigeria
-
 North Macedonia
-
 Norway
-
 Oman
-
 Pakistan
-
 Palestine
-
 Panama
-
 Papua New Guinea
-
 Paraguay
-
 Peru
-
 Philippines
-
 Poland
-
 Portugal
-
 Puerto Rico
-
 Qatar
-
 Reunion
-
 Romania
-
 Rwanda
-
 Saudi Arabia
-
 Serbia
-
 Singapore
-
 Slovakia
-
 Slovenia
-
 Somalia
-
 South Africa
-
 Spain
-
 Sri Lanka
-
 Sweden
-
 Switzerland
-
 Syria
-
 Taiwan
-
 Tajikistan
-
 Tanzania
-
 Thailand
-
 Trinidad and Tobago
-
 Tunisia
-
 Turkey
-
 UAE
-
 Uganda
-
 Ukraine
-
 United Kingdom
-
United States
-
 Uruguay
-
 Uzbekistan
-
 Venezuela
-
 Vietnam
-
 Yemen
-
 Zambia
-
 Zimbabwe
- Forex
- Crypto












