

Cisco shares technical analysis: Pullback signals persist on negative news

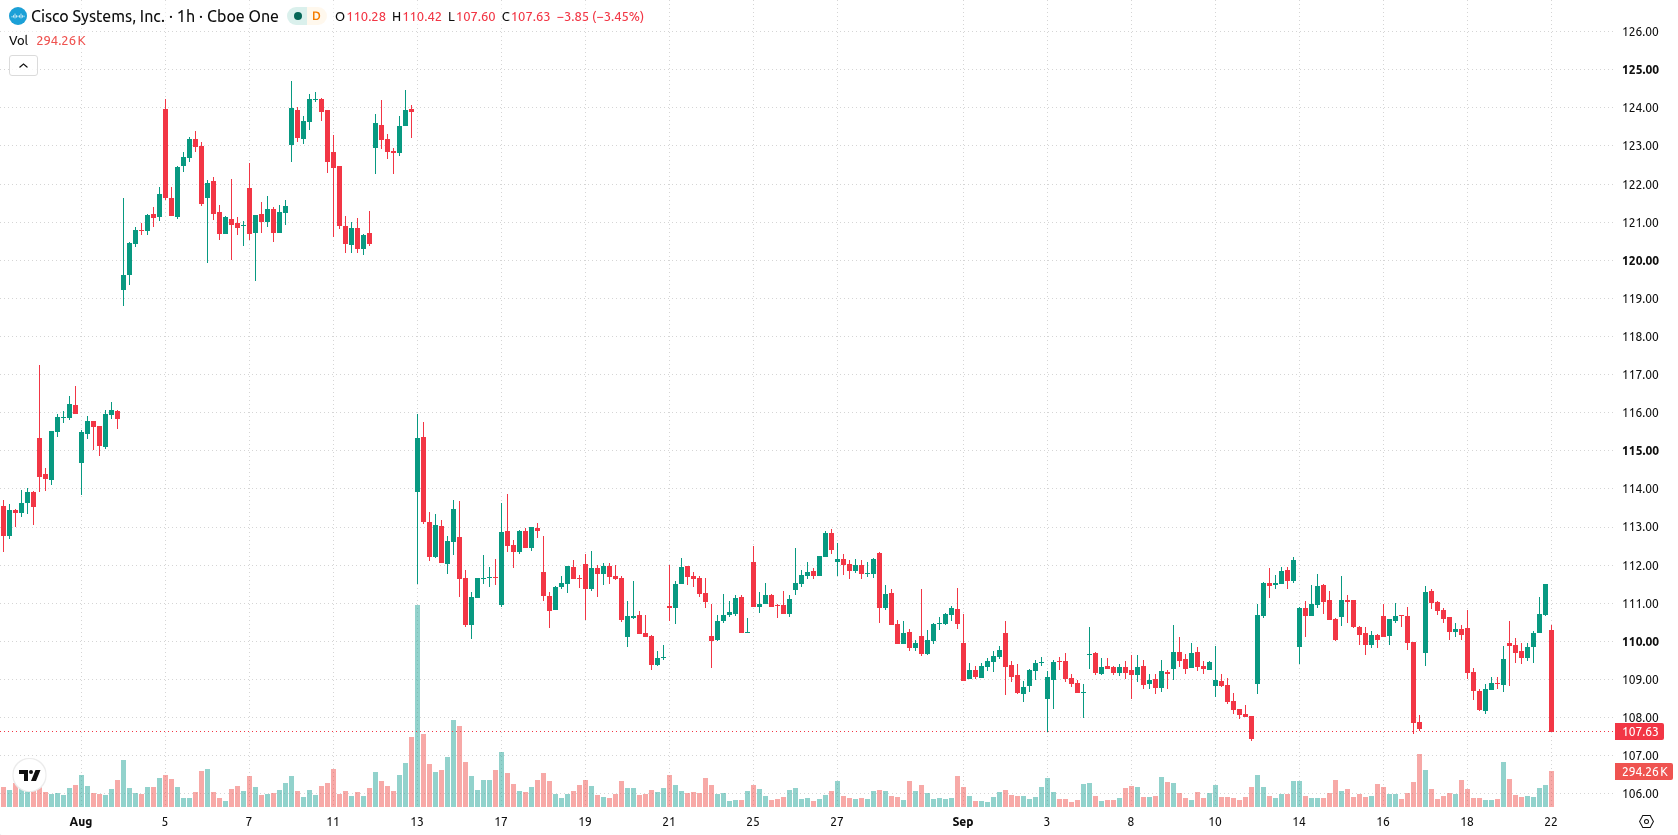
Cisco (CSCO) stock is trading at $108.21 after a daily decline of 2.92%. The stock is trading below its key short- and medium-term moving averages, indicating downward momentum in the near term.
 105.41
112.68
Highlights
- A critical vulnerability in Cisco Identity Services Engine and Passive Identity Connector has been actively exploited, allowing attackers to bypass authentication and access enterprise systems.
- This security breach raises reliability and operational risk concerns for Cisco, potentially undermining trust among enterprise customers relying on its security products.
- Cisco stock trades below key short- and medium-term technical levels, with bearish indicators and an expected trading range of $106.47 to $112.57 over the next 2 to 3 sessions.
Operational risk intensifies as cybersecurity breach hits core clients
A critical security vulnerability affecting Cisco Identity Services Engine and Cisco Identity Services Engine Passive Identity Connector has been actively exploited by attackers to bypass authentication and gain unauthorized access, according to Csa Gov. This incident raises significant concerns about product reliability and operational risk for Cisco, as it exposes core segments of its enterprise customer base to breaches. The urgent advisory for users to apply patches underscores the seriousness of the event and its potential impact on organizational trust in Cisco's security offerings.
Intraday sell signals and neutral momentum shape technical boundaries
On the technical side, CSCO/USD is trading below both the MA-20 and MA-50 on the hourly chart, but remains above the MA-200 on the daily timeframe. The Ichimoku Kijun level at $109.52 serves as immediate resistance. Momentum readings on the H1 chart are mixed: MACD and ADX show neutral momentum, while RSI shows a Sell and Stochastic RSI signals a Strong Sell, highlighting intraday bearish pressure. CCI is neutral, Bull/Bear Power indicates oversold conditions with seller dominance, and the Awesome Oscillator does not support the current move.
Downside risk dominates as muted upside depends on resistance break
In the short term, CSCO/USD is expected to trade within the $106.47 to $112.57 range over the next 2–3 sessions based on typical volatility. While the probability of an upward move appears very low, a downward move is considered much more likely under present conditions. A bullish scenario would require a clear break above the nearest resistance, while a bearish outcome unfolds if support levels give way.
Previously it was reported that Cisco shares were expected to trade in a range as mixed technical signals and rapid security updates shaped a neutral near-term outlook. The latest developments, including the active exploitation of a severe vulnerability and a shift to sustained technical weakness, now introduce heightened downside risk, with attention turning to maintaining support within the $106.47 to $112.57 trading range in the coming sessions.






Latest Cisco News




-
 Afghanistan
-
 Albania
-
 Algeria
-
 Angola
-
 Argentina
-
 Armenia
-
 Australia
-
 Austria
-
 Azerbaijan
-
 Bahamas
-
 Bahrain
-
 Bangladesh
-
 Belarus
-
 Belgium
-
 Bolivia
-
 Botswana
-
 Brazil
-
 Brunei
-
 Bulgaria
-
 Cambodia
-
 Cameroon
-
 Canada
-
 Chile
-
 China
-
 Colombia
-
 Congo
-
 Costa Rica
-
 Cote d'Ivoire
-
 Croatia
-
 Cuba
-
 Cyprus
-
 Czechia
-
 DR Congo
-
 Denmark
-
 Dominican Republic
-
 Ecuador
-
 Egypt
-
 El Salvador
-
 Estonia
-
 Eswatini
-
 Ethiopia
-
 Finland
-
 France
-
 Georgia
-
 Germany
-
 Ghana
-
 Greece
-
 Haiti
-
 Hong Kong
-
 Hungary
-
 India
-
 Indonesia
-
 Iran, Islamic republic
-
 Iraq
-
 Ireland
-
 Israel
-
 Italy
-
 Jamaica
-
 Japan
-
 Jordan
-
 Kazakhstan
-
 Kenya
-
 Korea
-
 Kuwait
-
 Kyrgyzstan
-
 Laos
-
 Latvia
-
 Lebanon
-
 Lesotho
-
 Libya
-
 Lithuania
-
 Luxembourg
-
 Madagascar
-
 Malaysia
-
 Malta
-
 Mauritius
-
 Mexico
-
 Moldova
-
 Mongolia
-
 Montenegro
-
 Morocco
-
 Mozambique
-
 Myanmar
-
 Namibia
-
 Nepal
-
 Netherlands
-
 New Zealand
-
 Nigeria
-
 North Macedonia
-
 Norway
-
 Oman
-
 Pakistan
-
 Palestine
-
 Panama
-
 Papua New Guinea
-
 Paraguay
-
 Peru
-
 Philippines
-
 Poland
-
 Portugal
-
 Puerto Rico
-
 Qatar
-
 Reunion
-
 Romania
-
 Rwanda
-
 Saudi Arabia
-
 Serbia
-
 Singapore
-
 Slovakia
-
 Slovenia
-
 Somalia
-
 South Africa
-
 Spain
-
 Sri Lanka
-
 Sweden
-
 Switzerland
-
 Syria
-
 Taiwan
-
 Tajikistan
-
 Tanzania
-
 Thailand
-
 Trinidad and Tobago
-
 Tunisia
-
 Turkey
-
 UAE
-
 Uganda
-
 Ukraine
-
 United Kingdom
-
United States
-
 Uruguay
-
 Uzbekistan
-
 Venezuela
-
 Vietnam
-
 Yemen
-
 Zambia
-
 Zimbabwe
- Forex
- Crypto












