

Can annual profit growth support Shopify stock?

Shopify Inc. (SHOP) stock is trading at $148.71, rising 7.8% on the session and ending well above its key moving averages. The price action keeps SHOP positioned strongly on both short and long-term trend metrics.
 152.52
153.66
Highlights
- Shopify confirmed a partnership with Meta Platforms to integrate Shop Pay into Meta's Muse AI, enabling direct AI-driven purchases on Shopify stores.
- Shopify reported $11.56 billion in annual revenue and $1.23 billion in net profit, providing strong fundamental support.
- Shares of Shopify gained 7.8% to $148.71 with robust bullish indicators, trading in a projected $143.55 to $156.87 range but signaling short-term overbought risk.
AI-driven partnership and strong fundamentals boost sentiment and revenue outlook
Shopify's confirmed partnership with Meta Platforms to integrate Shop Pay into the Muse AI assistant, as reported by Thepaypers, unlocks direct, AI-driven purchase capabilities for users across Shopify-powered stores. This move positions SHOP to capture transaction volume from the emerging intersection of AI and e-commerce, creating a new channel for user acquisition and revenue growth. Meta CEO Mark Zuckerberg reinforced the deal's significance and hinted at more such collaborations ahead, according to Finance Yahoo, supporting a forward-looking innovation narrative. Meanwhile, Shopify's reporting of $11.56 billion in annual revenue and $1.23 billion in net profit provides a robust operational backdrop and fundamental support for interest in the stock.
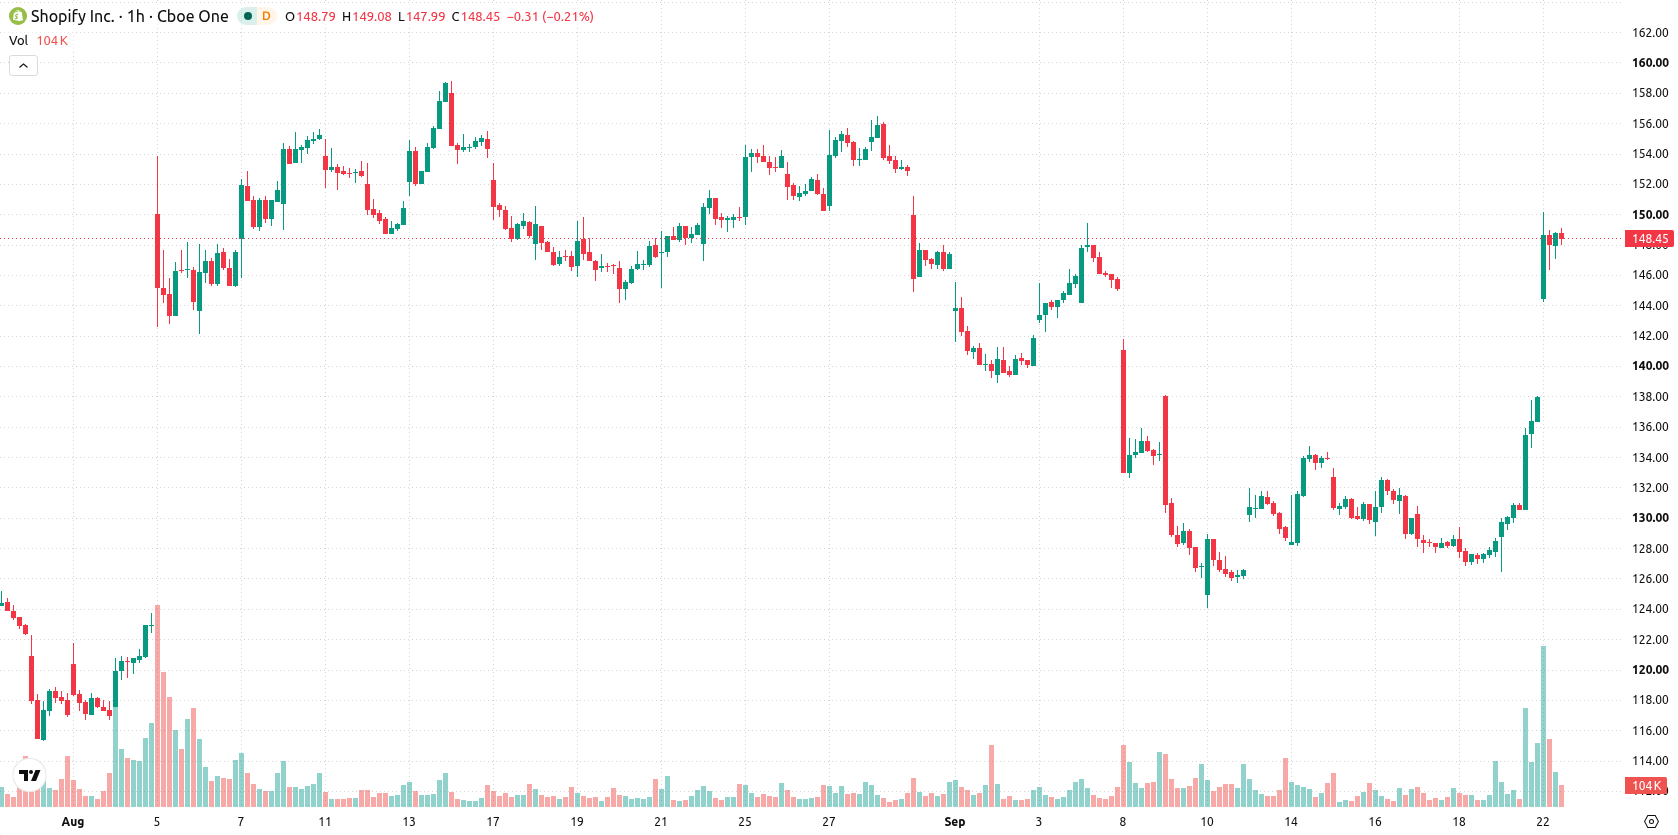
Overbought momentum as price outpaces clustered support zone
Technically, SHOP's key moving averages cluster in the $129.75 to $130.44 range, with price holding well above these levels. The Ichimoku Kijun on the daily chart sits at $132.23, marking immediate support for the uptrend. On the momentum side, MACD and ADX remain in buy mode, while RSI at 78.25, alongside Stochastic RSI, CCI, and Bull/Bear Power, highlight heavily overbought conditions. The Awesome Oscillator is also positive, but intraday volatility and overbought signals warn of possible short-term pullback risk.
Upside bias prevails as breakout appetite drives near-term risk
Near-term, SHOP is expected to trade within the $143.55 to $156.87 band, with a high (78%) probability of further upside amid ongoing demand for breakout scenarios. Should price clear the upper threshold, accelerated buying could extend the advance; conversely, a dip below immediate support would expose SHOP to deeper retracement risk. The baseline scenario envisions price moving sideways within the current volatility envelope, echoing recent market dynamics.
Earlier, analysts noted that Shopify was consolidating its uptrend, supported by enhanced regulatory capacity and a shift in technical momentum. The recent breakout, underpinned by the Meta partnership and record earnings, adds a new growth catalyst and places the $143.55 to $156.87 range as the next key band for traders to monitor for breakout continuation or a possible retracement.











-
 Afghanistan
-
 Albania
-
 Algeria
-
 Angola
-
 Argentina
-
 Armenia
-
 Australia
-
 Austria
-
 Azerbaijan
-
 Bahamas
-
 Bahrain
-
 Bangladesh
-
 Belarus
-
 Belgium
-
 Bolivia
-
 Botswana
-
 Brazil
-
 Brunei
-
 Bulgaria
-
 Cambodia
-
 Cameroon
-
 Canada
-
 Chile
-
 China
-
 Colombia
-
 Congo
-
 Costa Rica
-
 Cote d'Ivoire
-
 Croatia
-
 Cuba
-
 Cyprus
-
 Czechia
-
 DR Congo
-
 Denmark
-
 Dominican Republic
-
 Ecuador
-
 Egypt
-
 El Salvador
-
 Estonia
-
 Eswatini
-
 Ethiopia
-
 Finland
-
 France
-
 Georgia
-
 Germany
-
 Ghana
-
 Greece
-
 Haiti
-
 Hong Kong
-
 Hungary
-
 India
-
 Indonesia
-
 Iran, Islamic republic
-
 Iraq
-
 Ireland
-
 Israel
-
 Italy
-
 Jamaica
-
 Japan
-
 Jordan
-
 Kazakhstan
-
 Kenya
-
 Korea
-
 Kuwait
-
 Kyrgyzstan
-
 Laos
-
 Latvia
-
 Lebanon
-
 Lesotho
-
 Libya
-
 Lithuania
-
 Luxembourg
-
 Madagascar
-
 Malaysia
-
 Malta
-
 Mauritius
-
 Mexico
-
 Moldova
-
 Mongolia
-
 Montenegro
-
 Morocco
-
 Mozambique
-
 Myanmar
-
 Namibia
-
 Nepal
-
 Netherlands
-
 New Zealand
-
 Nigeria
-
 North Macedonia
-
 Norway
-
 Oman
-
 Pakistan
-
 Palestine
-
 Panama
-
 Papua New Guinea
-
 Paraguay
-
 Peru
-
 Philippines
-
 Poland
-
 Portugal
-
 Puerto Rico
-
 Qatar
-
 Reunion
-
 Romania
-
 Rwanda
-
 Saudi Arabia
-
 Serbia
-
 Singapore
-
 Slovakia
-
 Slovenia
-
 Somalia
-
 South Africa
-
 Spain
-
 Sri Lanka
-
 Sweden
-
 Switzerland
-
 Syria
-
 Taiwan
-
 Tajikistan
-
 Tanzania
-
 Thailand
-
 Trinidad and Tobago
-
 Tunisia
-
 Turkey
-
 UAE
-
 Uganda
-
 Ukraine
-
 United Kingdom
-
United States
-
 Uruguay
-
 Uzbekistan
-
 Venezuela
-
 Vietnam
-
 Yemen
-
 Zambia
-
 Zimbabwe
- Forex
- Crypto












