


Brown & Brown Inc (BRO) dropped 3.29% as broad technical selling pressure and pronounced negative momentum drove the move lower. The bearish tone is supported by the stock trading below all major moving averages and deep oversold readings across multiple indicators.
 70.49
73.12
Highlights
- Shares of Brown & Brown closed at $62.19, down 3.29% for the session amid heavy intraday volatility.
- Technical indicators confirm negative momentum with the stock trading below key moving averages and deeply oversold conditions.
- Over the next five sessions, price is expected to consolidate between $59.18 and $63.70, with over 80% probability of further downside.
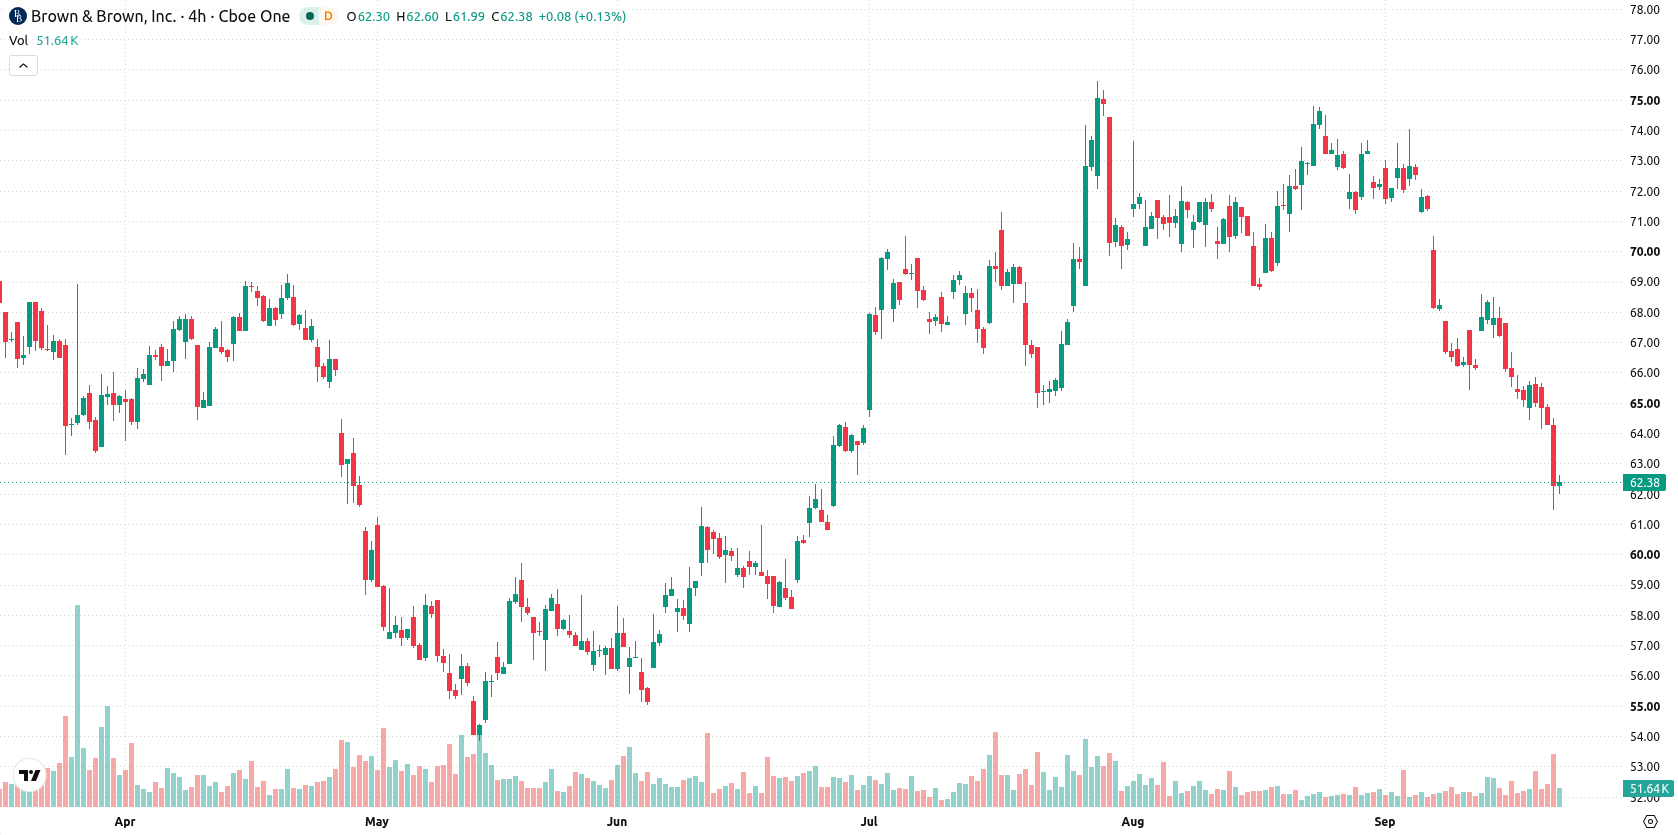
Multi-period breakdown as oversold readings deepen downside risk
Brown & Brown is trading below its 20-day ($69.45), 50-day ($69.87), and 200-day ($68.76) moving averages, indicating broad downside pressure across short-, medium-, and long-term horizons. The near-term floor is at $61.55, with resistance at $63.70. Although the 50-day and 200-day averages retain a longer-term bullish alignment, they only partially offset the current bearish momentum. Momentum signals are negative, with the MACD and ADX both indicating a sell setup. The Relative Strength Index (RSI) stands at 33.69, the Stochastic RSI is at 0, the CCI reads -107.96, and the Bull/Bear Power sits at -1.48, all confirming deep oversold territory. The Awesome Oscillator (AO) is also negative, reinforcing the dominant downward bias.
Earlier, analysts noted that Brown & Brown faced renewed downside risk as technical indicators turned more negative despite ongoing expansion efforts. The current update reinforces this bearish outlook, with deep oversold conditions and heightened volatility underscoring $59.18 as a pivotal support level to monitor for potential acceleration of losses.






Latest Brown & Brown News




-
 Afghanistan
-
 Albania
-
 Algeria
-
 Angola
-
 Argentina
-
 Armenia
-
 Australia
-
 Austria
-
 Azerbaijan
-
 Bahamas
-
 Bahrain
-
 Bangladesh
-
 Belarus
-
 Belgium
-
 Bolivia
-
 Botswana
-
 Brazil
-
 Brunei
-
 Bulgaria
-
 Cambodia
-
 Cameroon
-
 Canada
-
 Chile
-
 China
-
 Colombia
-
 Congo
-
 Costa Rica
-
 Cote d'Ivoire
-
 Croatia
-
 Cuba
-
 Cyprus
-
 Czechia
-
 DR Congo
-
 Denmark
-
 Dominican Republic
-
 Ecuador
-
 Egypt
-
 El Salvador
-
 Estonia
-
 Eswatini
-
 Ethiopia
-
 Finland
-
 France
-
 Georgia
-
 Germany
-
 Ghana
-
 Greece
-
 Haiti
-
 Hong Kong
-
 Hungary
-
 India
-
 Indonesia
-
 Iran, Islamic republic
-
 Iraq
-
 Ireland
-
 Israel
-
 Italy
-
 Jamaica
-
 Japan
-
 Jordan
-
 Kazakhstan
-
 Kenya
-
 Korea
-
 Kuwait
-
 Kyrgyzstan
-
 Laos
-
 Latvia
-
 Lebanon
-
 Lesotho
-
 Libya
-
 Lithuania
-
 Luxembourg
-
 Madagascar
-
 Malaysia
-
 Malta
-
 Mauritius
-
 Mexico
-
 Moldova
-
 Mongolia
-
 Montenegro
-
 Morocco
-
 Mozambique
-
 Myanmar
-
 Namibia
-
 Nepal
-
 Netherlands
-
 New Zealand
-
 Nigeria
-
 North Macedonia
-
 Norway
-
 Oman
-
 Pakistan
-
 Palestine
-
 Panama
-
 Papua New Guinea
-
 Paraguay
-
 Peru
-
 Philippines
-
 Poland
-
 Portugal
-
 Puerto Rico
-
 Qatar
-
 Reunion
-
 Romania
-
 Rwanda
-
 Saudi Arabia
-
 Serbia
-
 Singapore
-
 Slovakia
-
 Slovenia
-
 Somalia
-
 South Africa
-
 Spain
-
 Sri Lanka
-
 Sweden
-
 Switzerland
-
 Syria
-
 Taiwan
-
 Tajikistan
-
 Tanzania
-
 Thailand
-
 Trinidad and Tobago
-
 Tunisia
-
 Turkey
-
 UAE
-
 Uganda
-
 Ukraine
-
 United Kingdom
-
United States
-
 Uruguay
-
 Uzbekistan
-
 Venezuela
-
 Vietnam
-
 Yemen
-
 Zambia
-
 Zimbabwe
- Forex
- Crypto












