


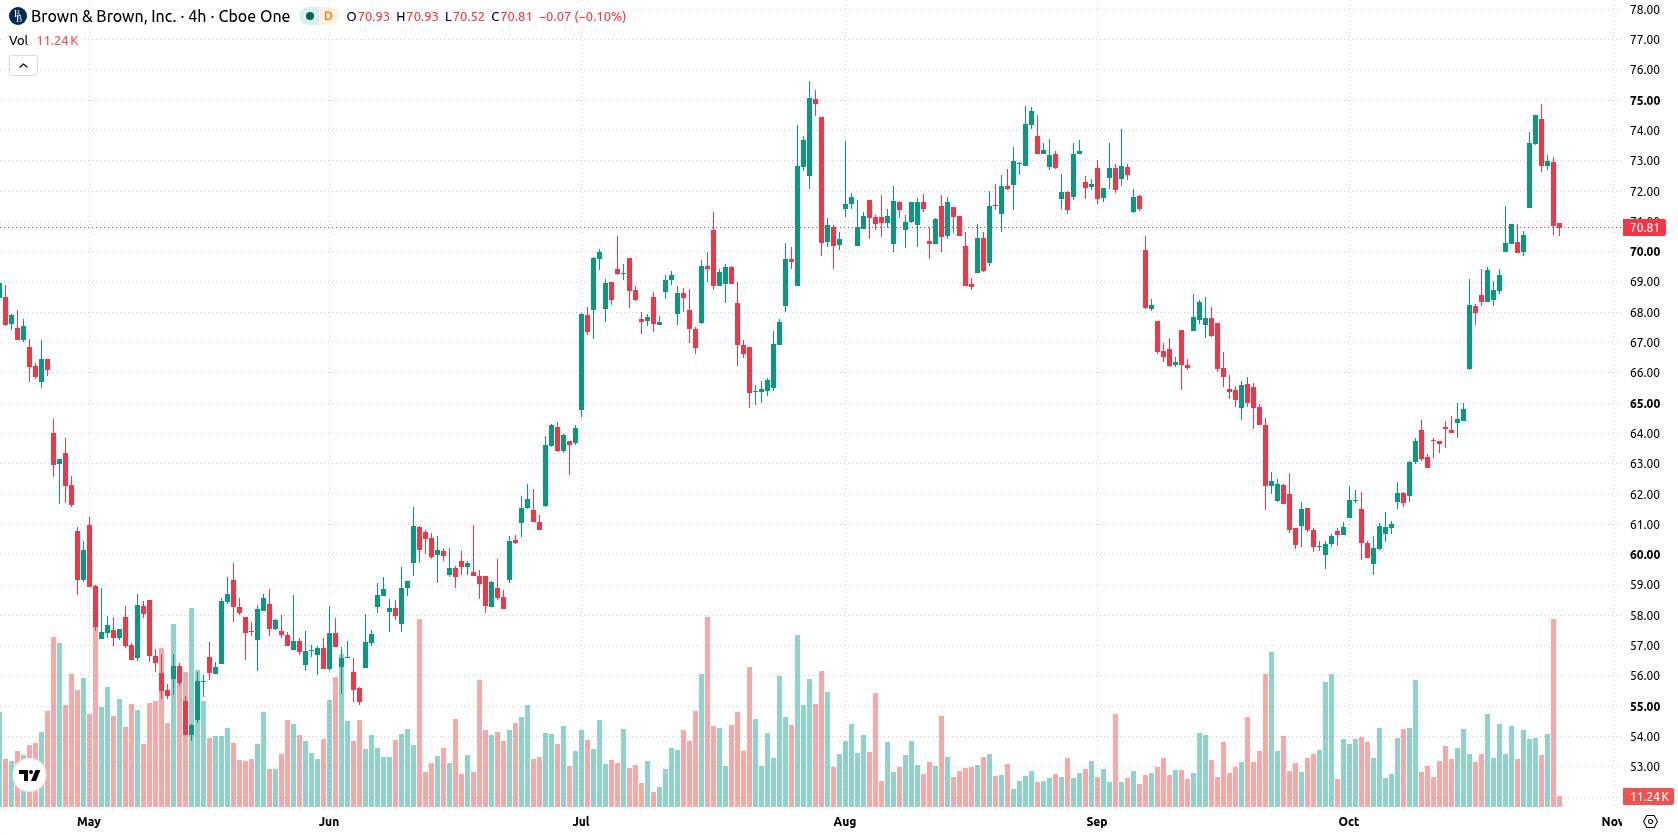
Brown & Brown Inc (BRO) slid 3.01% as short-term selling pressure overcame a series of positive corporate developments and recent momentum across the insurance sector. The move stands in contrast to its ongoing bullish technical setup, with the price still above all major moving averages and strong underlying momentum indicators.
 68.52
74.89
Highlights
- Brown & Brown increased its quarterly dividend to $0.18 per share, the 33rd consecutive annual rise.
- The company advanced its growth strategy by launching the COMPASS AI platform and integrating Accession Risk Management Group.
- Shares of Brown & Brown trade near $70.77 with robust but overbought momentum and an expected five-day range of $68.02 to $73.52.
Dividend hike and platform launch countered by persistent selling
On October 21, 2023, Brown & Brown announced a quarterly dividend increase from $0.17 to $0.18 per share, marking its 33rd consecutive annual rise. The company recently launched the COMPASS platform, an AI-driven risk and insurance decision tool consolidating proprietary data and analytics. Integration efforts for the Accession Risk Management Group acquisition have also been underway as part of a multi-year growth initiative, though price action has remained under broader selling pressure.
Overbought signals raise reversal risk despite multi-timeframe bullish setup
BRO trades above the 20-day, 50-day, and 200-day moving averages ($65.09, $67.23, and $66.91), reaffirming a bullish technical structure across timeframes. The 50-day and 200-day averages are aligned positively, supporting ongoing upward momentum. Key technical support lies near the Ichimoku Kijun level at $67.10, with immediate resistance at $73.12 and support at $70.72. Momentum remains strong; MACD and ADX both confirm persistent buying interest. The RSI reads 68.66, nearing overbought, and Stochastic RSI and CCI also indicate overbought conditions. Bull/Bear Power remains positive at 6.35, showing buyer dominance but signaling a heightened risk of reversal. The Awesome Oscillator further reinforces the prevailing trend. Despite strong previous momentum, the stock is currently under sessional pressure, suggesting profit-taking or a short-term reversal as volatility rises to 3.39%.
Earlier, analysts noted that Brown & Brown faced pronounced downside momentum and oversold conditions, signaling heightened risks for further losses. The current article highlights a reversal in technical structure, with bullish momentum now prevailing, making a break above $73.12 a key level to watch for renewed upside potential.






Latest Brown & Brown News





-
 Afghanistan
-
 Albania
-
 Algeria
-
 Angola
-
 Argentina
-
 Armenia
-
 Australia
-
 Austria
-
 Azerbaijan
-
 Bahamas
-
 Bahrain
-
 Bangladesh
-
 Belarus
-
 Belgium
-
 Bolivia
-
 Botswana
-
 Brazil
-
 Brunei
-
 Bulgaria
-
 Cambodia
-
 Cameroon
-
 Canada
-
 Chile
-
 China
-
 Colombia
-
 Congo
-
 Costa Rica
-
 Cote d'Ivoire
-
 Croatia
-
 Cuba
-
 Cyprus
-
 Czechia
-
 DR Congo
-
 Denmark
-
 Dominican Republic
-
 Ecuador
-
 Egypt
-
 El Salvador
-
 Estonia
-
 Eswatini
-
 Ethiopia
-
 Finland
-
 France
-
 Georgia
-
 Germany
-
 Ghana
-
 Greece
-
 Haiti
-
 Hong Kong
-
 Hungary
-
 India
-
 Indonesia
-
 Iran, Islamic republic
-
 Iraq
-
 Ireland
-
 Israel
-
 Italy
-
 Jamaica
-
 Japan
-
 Jordan
-
 Kazakhstan
-
 Kenya
-
 Korea
-
 Kuwait
-
 Kyrgyzstan
-
 Laos
-
 Latvia
-
 Lebanon
-
 Lesotho
-
 Libya
-
 Lithuania
-
 Luxembourg
-
 Madagascar
-
 Malaysia
-
 Malta
-
 Mauritius
-
 Mexico
-
 Moldova
-
 Mongolia
-
 Montenegro
-
 Morocco
-
 Mozambique
-
 Myanmar
-
 Namibia
-
 Nepal
-
 Netherlands
-
 New Zealand
-
 Nigeria
-
 North Macedonia
-
 Norway
-
 Oman
-
 Pakistan
-
 Palestine
-
 Panama
-
 Papua New Guinea
-
 Paraguay
-
 Peru
-
 Philippines
-
 Poland
-
 Portugal
-
 Puerto Rico
-
 Qatar
-
 Reunion
-
 Romania
-
 Rwanda
-
 Saudi Arabia
-
 Serbia
-
 Singapore
-
 Slovakia
-
 Slovenia
-
 Somalia
-
 South Africa
-
 Spain
-
 Sri Lanka
-
 Sweden
-
 Switzerland
-
 Syria
-
 Taiwan
-
 Tajikistan
-
 Tanzania
-
 Thailand
-
 Trinidad and Tobago
-
 Tunisia
-
 Turkey
-
 UAE
-
 Uganda
-
 Ukraine
-
 United Kingdom
-
United States
-
 Uruguay
-
 Uzbekistan
-
 Venezuela
-
 Vietnam
-
 Yemen
-
 Zambia
-
 Zimbabwe
- Forex
- Crypto












