

SIRI slides over 3% as stock trades below key moving averages amid heavy selling

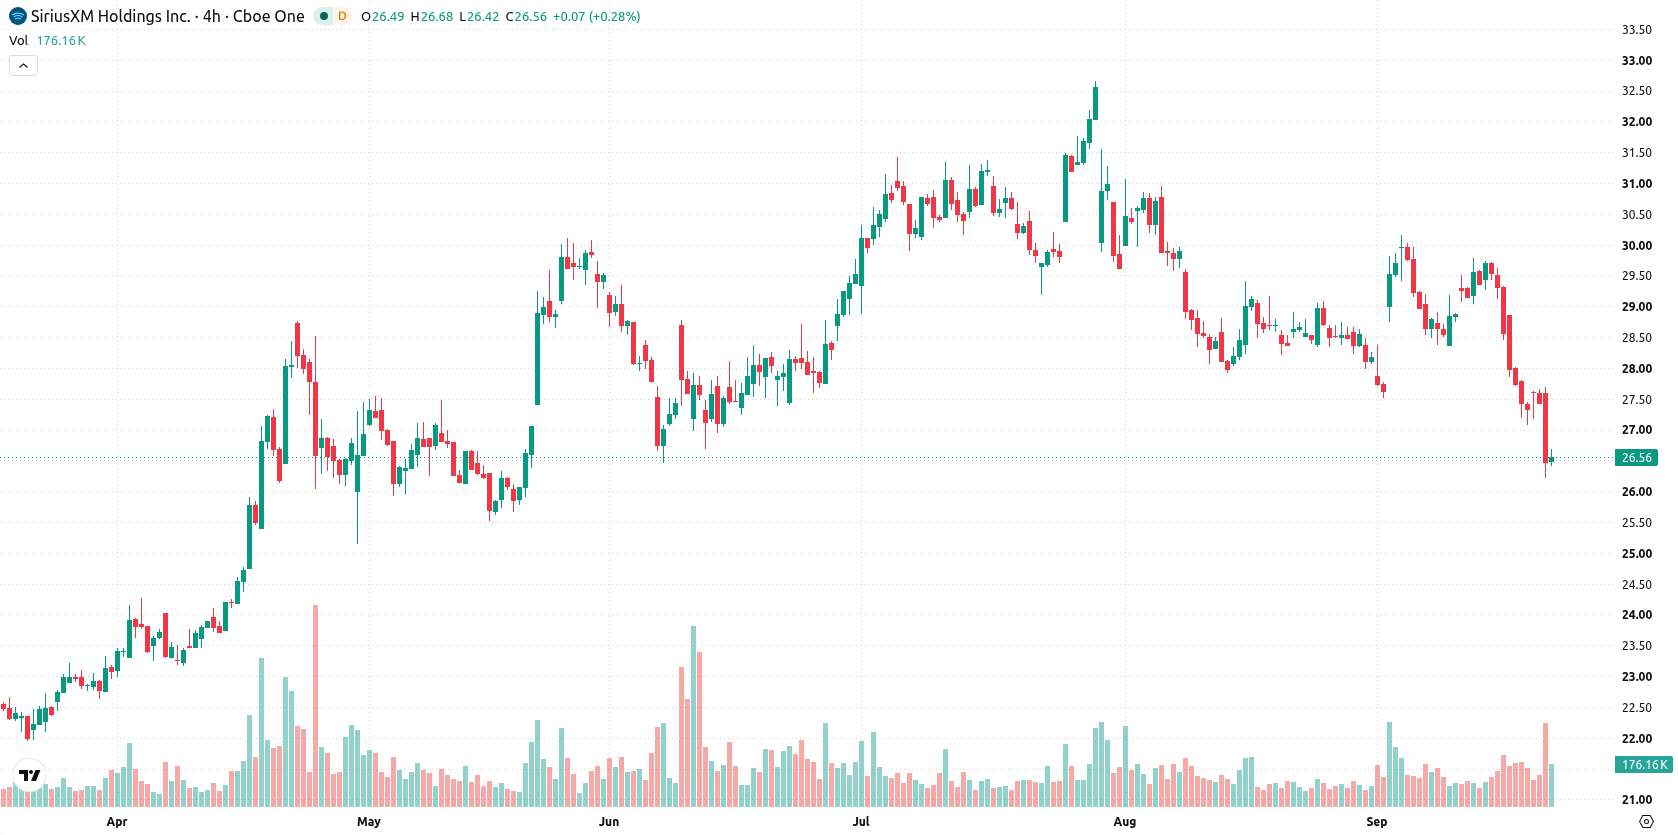
Sirius XM Holdings Inc. (SIRI) fell 3.26% as selling pressure and weak short-term momentum continued to drive losses. The move is supported by the stock trading below its 20- and 50-day moving averages, with intraday indicators confirming seller dominance.
 27.47
27.47
27.47
27.47
Highlights
- Sirius XM stock is trading below short- and medium-term moving averages with ongoing pressure from sellers.
- Momentum indicators including RSI, MACD, CCI, and Bull/Bear Power all show weak momentum and oversold conditions.
- Expected price range for the next five days is $25.3 to $27.82, with a 67% probability of a downward move.
Short-term pressure as sellers prevail below key averages
Sirius XM is trading below its 20-day and 50-day moving averages ($28.61 and $29.39), signaling continued short- and medium-term pressure from sellers. The price holds above the 200-day moving average ($25.42), keeping longer-term support intact and showing a bullish alignment between the 50- and 200-day averages. Resistance is found at $27.1 and support at $26.3. The Relative Strength Index (RSI) stands at 39.23 with a sell signal, and MACD is negative, both pointing to weak momentum. The Average Directional Index (ADX) indicates a neutral trend. Stochastic RSI, CCI, and Bull/Bear Power (BBP) remain in oversold territory, confirming intraday seller control. The Awesome Oscillator is neutral, while BBP's negative value and CCI's deep oversold reading reflect heavy selling. The stock is near the session low with intraday volatility at 5.32%. The overall tone remains pressured after the open, reinforcing weak momentum and persistent selling.
Previously it was reported that Sirius XM was maintaining a broad bullish trend despite mixed technical indicators suggesting caution was warranted. The current technical setup signals a shift toward increased downside risk, making the $25.3 level critical to watch for confirmation of a more sustained bearish move.





Latest Sirius XM Holding News




-
 Afghanistan
-
 Albania
-
 Algeria
-
 Angola
-
 Argentina
-
 Armenia
-
 Australia
-
 Austria
-
 Azerbaijan
-
 Bahamas
-
 Bahrain
-
 Bangladesh
-
 Belarus
-
 Belgium
-
 Bolivia
-
 Botswana
-
 Brazil
-
 Brunei
-
 Bulgaria
-
 Cambodia
-
 Cameroon
-
 Canada
-
 Chile
Chile
-
 China
China
-
 Colombia
-
 Congo
Congo
-
 Costa Rica
-
 Cote d'Ivoire
-
 Croatia
-
 Cuba
Cuba
-
 Cyprus
-
 Czechia
-
 DR Congo
-
 Denmark
-
 Dominican Republic
-
 Ecuador
-
 Egypt
Egypt
-
 El Salvador
-
 Estonia
-
 Eswatini
-
 Ethiopia
-
 Finland
-
 France
-
 Georgia
-
 Germany
-
 Ghana
Ghana
-
 Greece
-
 Haiti
Haiti
-
 Hong Kong
-
 Hungary
-
 India
India
-
 Indonesia
-
 Iran, Islamic republic
-
 Iraq
Iraq
-
 Ireland
-
 Israel
-
 Italy
Italy
-
 Jamaica
-
 Japan
Japan
-
 Jordan
-
 Kazakhstan
-
 Kenya
Kenya
-
 Korea
Korea
-
 Kuwait
-
 Kyrgyzstan
-
 Laos
Laos
-
 Latvia
-
 Lebanon
-
 Lesotho
-
 Libya
Libya
-
 Lithuania
-
 Luxembourg
-
 Madagascar
-
 Malaysia
-
 Malta
Malta
-
 Mauritius
-
 Mexico
-
 Moldova
-
 Mongolia
-
 Montenegro
-
 Morocco
-
 Mozambique
-
 Myanmar
-
 Namibia
-
 Nepal
Nepal
-
 Netherlands
-
 New Zealand
-
 Nigeria
-
 North Macedonia
-
 Norway
-
 Oman
Oman
-
 Pakistan
-
 Palestine
-
 Panama
-
 Papua New Guinea
-
 Paraguay
-
 Peru
Peru
-
 Philippines
-
 Poland
-
 Portugal
-
 Puerto Rico
-
 Qatar
Qatar
-
 Reunion
-
 Romania
-
 Rwanda
-
 Saudi Arabia
-
 Serbia
-
 Singapore
-
 Slovakia
-
 Slovenia
-
 Somalia
-
 South Africa
-
 Spain
Spain
-
 Sri Lanka
-
 Sweden
-
 Switzerland
-
 Syria
Syria
-
 Taiwan
-
 Tajikistan
-
 Tanzania
-
 Thailand
-
 Trinidad and Tobago
-
 Tunisia
-
 Turkey
-
 UAE
UAE
-
 Uganda
-
 Ukraine
-
 United Kingdom
-
United States
-
 Uruguay
-
 Uzbekistan
-
 Venezuela
-
 Vietnam
-
 Yemen
Yemen
-
 Zambia
-
 Zimbabwe
- Forex
- Crypto












