

Why is TELUS stock flat today? Key support levels to watch

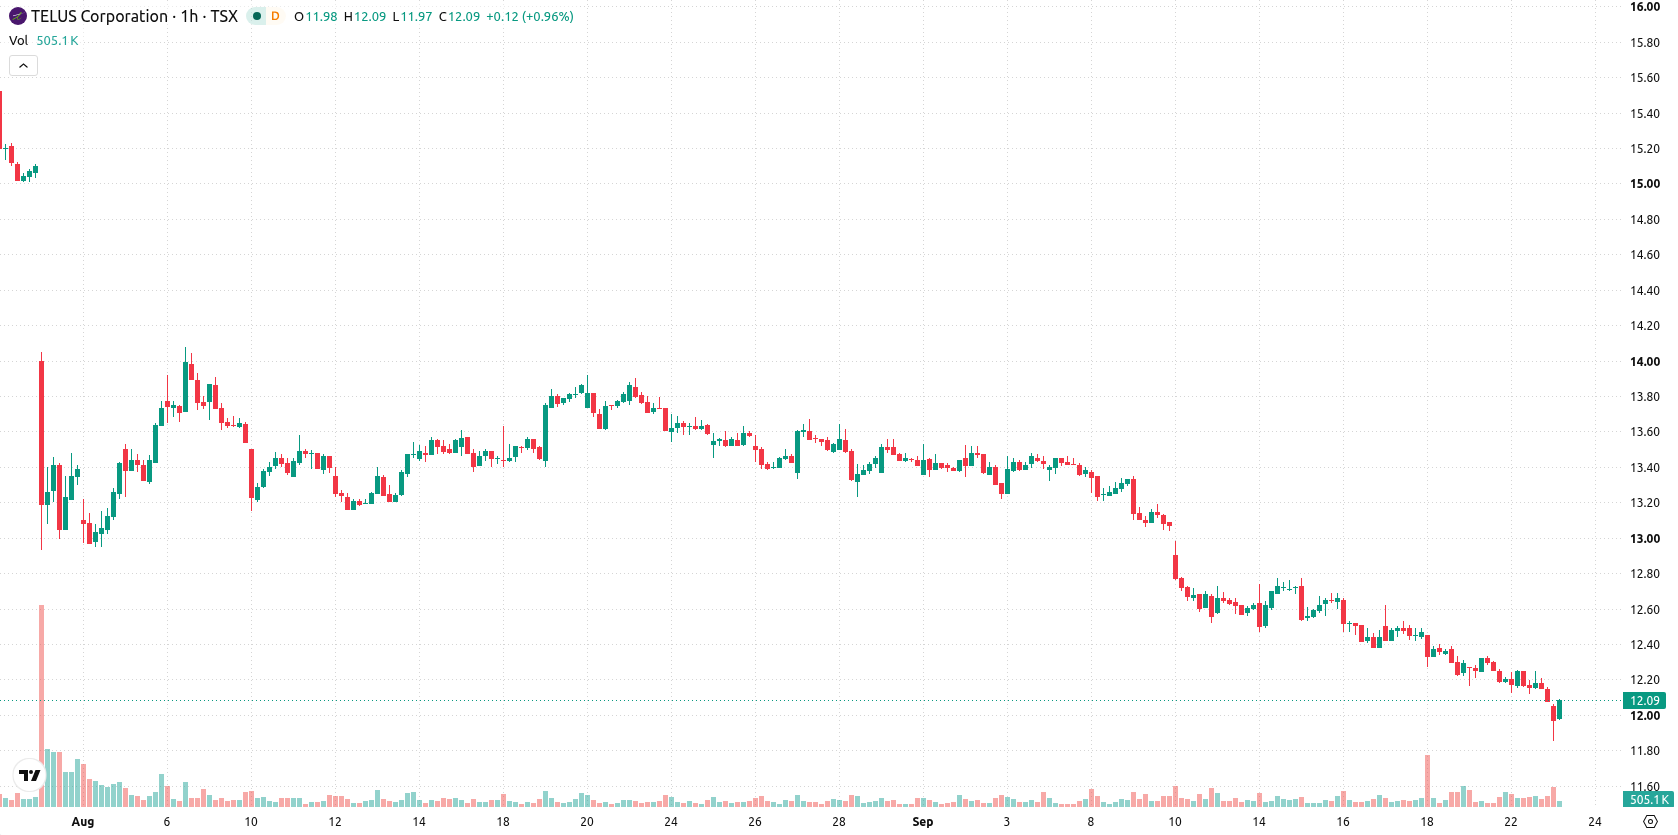
TELUS (T) stock is trading at C$12.07, marking a slight decline on the day. The price remains below its key moving averages, signaling continued short-term and longer-term weakness.
 13.25
13.25
Highlights
- TELUS stock trades below key short- and long-term moving averages, confirming sustained selling pressure across multiple timeframes.
- Bearish momentum dominates as multiple indicators signal downside risk, with shares closing at C$12.07 near the session low.
- TELUS stock is forecast to hold between C$11.84 to C$12.30, with a low probability of upside reversal unless resistance at C$12.31 is breached.
Downside momentum accelerates as multiple signals flash oversold
On the technical side, T is trading below the MA-20 and MA-50 on the H1 chart, and remains well under the MA-200 on the daily timeframe. The Ichimoku Kijun level at C$12.31 serves as immediate resistance. Momentum signals are mostly negative: MACD and ADX suggest continued downside pressure, with RSI at 29.94, Stoch RSI, and CCI all indicating oversold conditions. Bull/Bear Power further highlights intraday downside dominance, while the Awesome Oscillator is neutral.
Further declines favored as consolidation persists within set range
In the near term, T is expected to consolidate within the C$11.84 to C$12.30 range. The probability of a sustained upward move is very low, while further declines are more likely. Any break above C$12.31 would be required to change this outlook, while a dip below C$11.84 could trigger further downside.
Earlier, analysts noted that TELUS faced persistent downside momentum and heightened risk following its significant dividend cut and negative technical signals. The current technical setup further supports this bearish outlook, with the immediate focus on potential downside risk should the price fall below the key C$11.84 support level.










-
 Afghanistan
-
 Albania
-
 Algeria
-
 Angola
-
 Argentina
-
 Armenia
-
 Australia
-
 Austria
-
 Azerbaijan
-
 Bahamas
-
 Bahrain
-
 Bangladesh
-
 Belarus
-
 Belgium
-
 Bolivia
-
 Botswana
-
 Brazil
-
 Brunei
-
 Bulgaria
-
 Cambodia
-
 Cameroon
-
 Canada
-
 Chile
-
 China
-
 Colombia
-
 Congo
-
 Costa Rica
-
 Cote d'Ivoire
-
 Croatia
-
 Cuba
-
 Cyprus
-
 Czechia
-
 DR Congo
-
 Denmark
-
 Dominican Republic
-
 Ecuador
-
 Egypt
-
 El Salvador
-
 Estonia
-
 Eswatini
-
 Ethiopia
-
 Finland
-
 France
-
 Georgia
-
 Germany
-
 Ghana
-
 Greece
-
 Haiti
-
 Hong Kong
-
 Hungary
-
 India
-
 Indonesia
-
 Iran, Islamic republic
-
 Iraq
-
 Ireland
-
 Israel
-
 Italy
-
 Jamaica
-
 Japan
-
 Jordan
-
 Kazakhstan
-
 Kenya
-
 Korea
-
 Kuwait
-
 Kyrgyzstan
-
 Laos
-
 Latvia
-
 Lebanon
-
 Lesotho
-
 Libya
-
 Lithuania
-
 Luxembourg
-
 Madagascar
-
 Malaysia
-
 Malta
-
 Mauritius
-
 Mexico
-
 Moldova
-
 Mongolia
-
 Montenegro
-
 Morocco
-
 Mozambique
-
 Myanmar
-
 Namibia
-
 Nepal
-
 Netherlands
-
 New Zealand
-
 Nigeria
-
 North Macedonia
-
 Norway
-
 Oman
-
 Pakistan
-
 Palestine
-
 Panama
-
 Papua New Guinea
-
 Paraguay
-
 Peru
-
 Philippines
-
 Poland
-
 Portugal
-
 Puerto Rico
-
 Qatar
-
 Reunion
-
 Romania
-
 Rwanda
-
 Saudi Arabia
-
 Serbia
-
 Singapore
-
 Slovakia
-
 Slovenia
-
 Somalia
-
 South Africa
-
 Spain
-
 Sri Lanka
-
 Sweden
-
 Switzerland
-
 Syria
-
 Taiwan
-
 Tajikistan
-
 Tanzania
-
 Thailand
-
 Trinidad and Tobago
-
 Tunisia
-
 Turkey
-
 UAE
-
 Uganda
-
 Ukraine
-
 United Kingdom
-
United States
-
 Uruguay
-
 Uzbekistan
-
 Venezuela
-
 Vietnam
-
 Yemen
-
 Zambia
-
 Zimbabwe
- Forex
- Crypto












