

NuCana stock trades near $1.26 support amid persistent pullback pressure

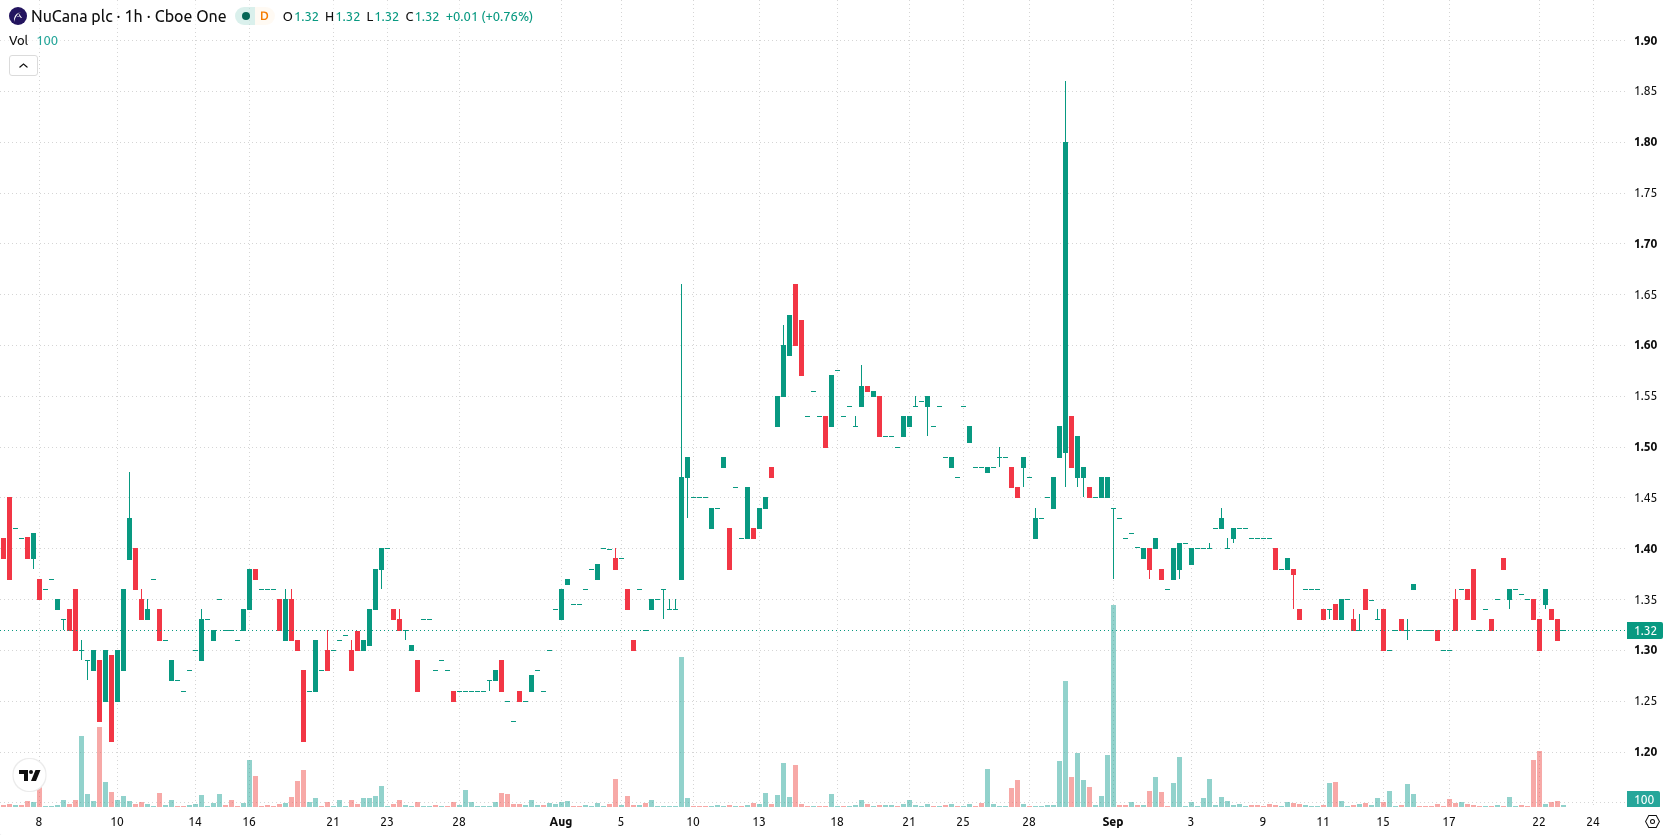
NuCana (NCNA) stock is trading at $1.3 and has slipped 4.41% over the last session. The price remains below its key moving averages, reflecting ongoing downward momentum.
 1.04
1.14
1.04
1.14
Highlights
- NCNA/USD trades under key moving averages with seller pressure evident across short and long-term timeframes.
- Oscillators and momentum indicators deliver conflicting signals, with some buyer support but overall downside bias in daily action.
- Price is at $1.3, forecast to move within $1.26 to $1.38, and a downside move is much more likely.
Mixed momentum signals as oscillators suggest short-term downside
NCNA/USD trades below the MA-20 and MA-50 ($1.34) on the hourly chart and remains firmly under the long-term MA-200 ($2.11). The Ichimoku Kijun at $1.35 acts as immediate resistance. Momentum indicators send mixed signals: MACD is Neutral, ADX suggests persistent buyer strength, while RSI and Stoch RSI indicate Sell. CCI is Neutral, and Bull/Bear Power favors buyers intraday. Awesome Oscillator is Neutral. This reveals a short-term contradiction, with oscillators showing downside pressure but some momentum measures reflecting buyer support.
Downside risk elevated as narrow range limits upside potential
Looking ahead, NCNA/USD is expected to consolidate within the $1.26 to $1.38 range. The probability of a move higher is very low, while the downside risk is considerable. A break above $1.35 would be needed to trigger a bullish scenario, whereas a drop below $1.26 could signal further weakness and intensify selling pressure.
Earlier, analysts noted that NuCana's technical structure suggested a period of sideways consolidation amid mixed momentum signals and increased downside risk. The current analysis reinforces this view, highlighting that ongoing downward momentum and conflicting indicators keep downside risk elevated, with $1.26 as a decisive support level to monitor for potential accelerated selling.










-
 Afghanistan
-
 Albania
-
 Algeria
-
 Angola
-
 Argentina
-
 Armenia
-
 Australia
-
 Austria
-
 Azerbaijan
-
 Bahamas
-
 Bahrain
-
 Bangladesh
-
 Belarus
-
 Belgium
-
 Bolivia
-
 Botswana
-
 Brazil
-
 Brunei
-
 Bulgaria
-
 Cambodia
-
 Cameroon
-
 Canada
-
 Chile
Chile
-
 China
China
-
 Colombia
-
 Congo
Congo
-
 Costa Rica
-
 Cote d'Ivoire
-
 Croatia
-
 Cuba
Cuba
-
 Cyprus
-
 Czechia
-
 DR Congo
-
 Denmark
-
 Dominican Republic
-
 Ecuador
-
 Egypt
Egypt
-
 El Salvador
-
 Estonia
-
 Eswatini
-
 Ethiopia
-
 Finland
-
 France
-
 Georgia
-
 Germany
-
 Ghana
Ghana
-
 Greece
-
 Haiti
Haiti
-
 Hong Kong
-
 Hungary
-
 India
India
-
 Indonesia
-
 Iran, Islamic republic
-
 Iraq
Iraq
-
 Ireland
-
 Israel
-
 Italy
Italy
-
 Jamaica
-
 Japan
Japan
-
 Jordan
-
 Kazakhstan
-
 Kenya
Kenya
-
 Korea
Korea
-
 Kuwait
-
 Kyrgyzstan
-
 Laos
Laos
-
 Latvia
-
 Lebanon
-
 Lesotho
-
 Libya
Libya
-
 Lithuania
-
 Luxembourg
-
 Madagascar
-
 Malaysia
-
 Malta
Malta
-
 Mauritius
-
 Mexico
-
 Moldova
-
 Mongolia
-
 Montenegro
-
 Morocco
-
 Mozambique
-
 Myanmar
-
 Namibia
-
 Nepal
Nepal
-
 Netherlands
-
 New Zealand
-
 Nigeria
-
 North Macedonia
-
 Norway
-
 Oman
Oman
-
 Pakistan
-
 Palestine
-
 Panama
-
 Papua New Guinea
-
 Paraguay
-
 Peru
Peru
-
 Philippines
-
 Poland
-
 Portugal
-
 Puerto Rico
-
 Qatar
Qatar
-
 Reunion
-
 Romania
-
 Rwanda
-
 Saudi Arabia
-
 Serbia
-
 Singapore
-
 Slovakia
-
 Slovenia
-
 Somalia
-
 South Africa
-
 Spain
Spain
-
 Sri Lanka
-
 Sweden
-
 Switzerland
-
 Syria
Syria
-
 Taiwan
-
 Tajikistan
-
 Tanzania
-
 Thailand
-
 Trinidad and Tobago
-
 Tunisia
-
 Turkey
-
 UAE
UAE
-
 Uganda
-
 Ukraine
-
 United Kingdom
-
United States
-
 Uruguay
-
 Uzbekistan
-
 Venezuela
-
 Vietnam
-
 Yemen
Yemen
-
 Zambia
-
 Zimbabwe
- Forex
- Crypto












