


FMC Corporation (FMC) fell 3.5% today, driven by sustained bearish momentum after its recent earnings report and in advance of further updates expected at the next checkpoint. The decline is reinforced by FMC trading below its 20-day, 50-day, and 200-day moving averages, highlighting strong downside pressure.
 5.51
8.31
Highlights
- FMC Corp stock closed at $10.28 on September 21, 2026, reflecting a 0.29 percent decrease from the previous day.
- FMC Corp reported second-quarter 2026 revenue of $867.1 million and will provide additional updates at the October earnings checkpoint.
- FMC Corp stock trades below key moving averages with broad technical indicators forecasting further downside and a predicted range of $9.64 to $10.75 over the next five days.
Investor caution rises ahead of October updates after muted Q2 report
FMC Corp closed at USD 10.28 on September 21, 2026, representing a decrease of 0.29 percent from the previous close. For the second quarter of fiscal year 2026, FMC Corp reported revenue of USD 867.1 million. The company is expected to provide further financial updates at its upcoming October earnings checkpoint.
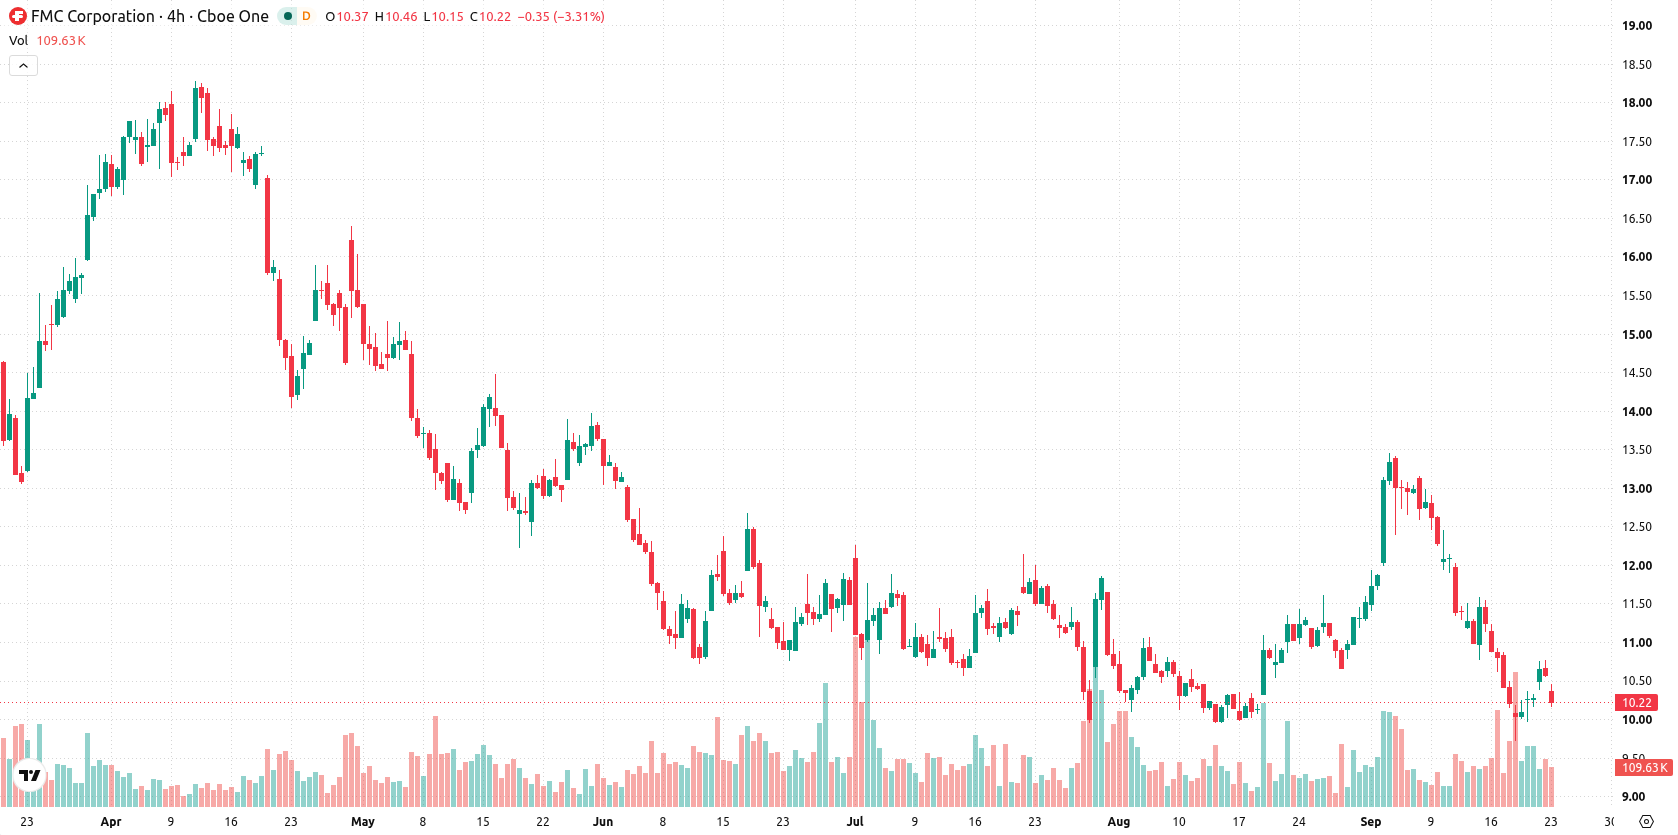
Prolonged technical weakness as momentum and support levels erode
FMC is trading below its 20-day, 50-day, and 200-day moving averages ($11.49, $11.09, and $13.38 respectively), which indicates continued downside pressure across short-, medium-, and longer-term trends. The nearest levels are $10.16 as support and $10.49 as resistance, with distant overhead averages reinforcing prevailing bearish momentum. Momentum signals remain negative as the Moving Average Convergence Divergence (MACD) forecasts a sell and the Average Directional Index (ADX) suggests a weak trend. Both the Relative Strength Index (RSI) at 43.25 and the Commodity Channel Index (CCI) at -79.88 are aligned with further selling, and the Stochastic RSI signals oversold conditions. Bull/Bear Power (BBP) is negative at -0.24, showing sellers dominate intraday momentum and confirming an oversold stance on the same indicator. The Awesome Oscillator (AO) also points to ongoing selling pressure. FMC is down $0.37 or 3.5% today, opening with a downside gap of about 1.42%. The stock trades near session lows, and intraday volatility stands at 3.25%. Downward price pressure persists after the open, in line with overall bearish momentum.
Earlier, analysts noted that FMC continued to face enduring technical resistance and mixed momentum, limiting the potential for a bullish reversal. The current setup reinforces this bearish scenario, with volatility favoring downside risk and $10.16 now serving as the critical level to watch in the sessions ahead.





Latest FMC Corporation News




-
 Afghanistan
-
 Albania
-
 Algeria
-
 Angola
-
 Argentina
-
 Armenia
-
 Australia
-
 Austria
-
 Azerbaijan
-
 Bahamas
-
 Bahrain
-
 Bangladesh
-
 Belarus
-
 Belgium
-
 Bolivia
-
 Botswana
-
 Brazil
-
 Brunei
-
 Bulgaria
-
 Cambodia
-
 Cameroon
-
 Canada
-
 Chile
-
 China
-
 Colombia
-
 Congo
-
 Costa Rica
-
 Cote d'Ivoire
-
 Croatia
-
 Cuba
-
 Cyprus
-
 Czechia
-
 DR Congo
-
 Denmark
-
 Dominican Republic
-
 Ecuador
-
 Egypt
-
 El Salvador
-
 Estonia
-
 Eswatini
-
 Ethiopia
-
 Finland
-
 France
-
 Georgia
-
 Germany
-
 Ghana
-
 Greece
-
 Haiti
-
 Hong Kong
-
 Hungary
-
 India
-
 Indonesia
-
 Iran, Islamic republic
-
 Iraq
-
 Ireland
-
 Israel
-
 Italy
-
 Jamaica
-
 Japan
-
 Jordan
-
 Kazakhstan
-
 Kenya
-
 Korea
-
 Kuwait
-
 Kyrgyzstan
-
 Laos
-
 Latvia
-
 Lebanon
-
 Lesotho
-
 Libya
-
 Lithuania
-
 Luxembourg
-
 Madagascar
-
 Malaysia
-
 Malta
-
 Mauritius
-
 Mexico
-
 Moldova
-
 Mongolia
-
 Montenegro
-
 Morocco
-
 Mozambique
-
 Myanmar
-
 Namibia
-
 Nepal
-
 Netherlands
-
 New Zealand
-
 Nigeria
-
 North Macedonia
-
 Norway
-
 Oman
-
 Pakistan
-
 Palestine
-
 Panama
-
 Papua New Guinea
-
 Paraguay
-
 Peru
-
 Philippines
-
 Poland
-
 Portugal
-
 Puerto Rico
-
 Qatar
-
 Reunion
-
 Romania
-
 Rwanda
-
 Saudi Arabia
-
 Serbia
-
 Singapore
-
 Slovakia
-
 Slovenia
-
 Somalia
-
 South Africa
-
 Spain
-
 Sri Lanka
-
 Sweden
-
 Switzerland
-
 Syria
-
 Taiwan
-
 Tajikistan
-
 Tanzania
-
 Thailand
-
 Trinidad and Tobago
-
 Tunisia
-
 Turkey
-
 UAE
-
 Uganda
-
 Ukraine
-
 United Kingdom
-
United States
-
 Uruguay
-
 Uzbekistan
-
 Venezuela
-
 Vietnam
-
 Yemen
-
 Zambia
-
 Zimbabwe
- Forex
- Crypto












