

Lucid Group shares drop over 4% after Bolt deal and renewed structural weakness

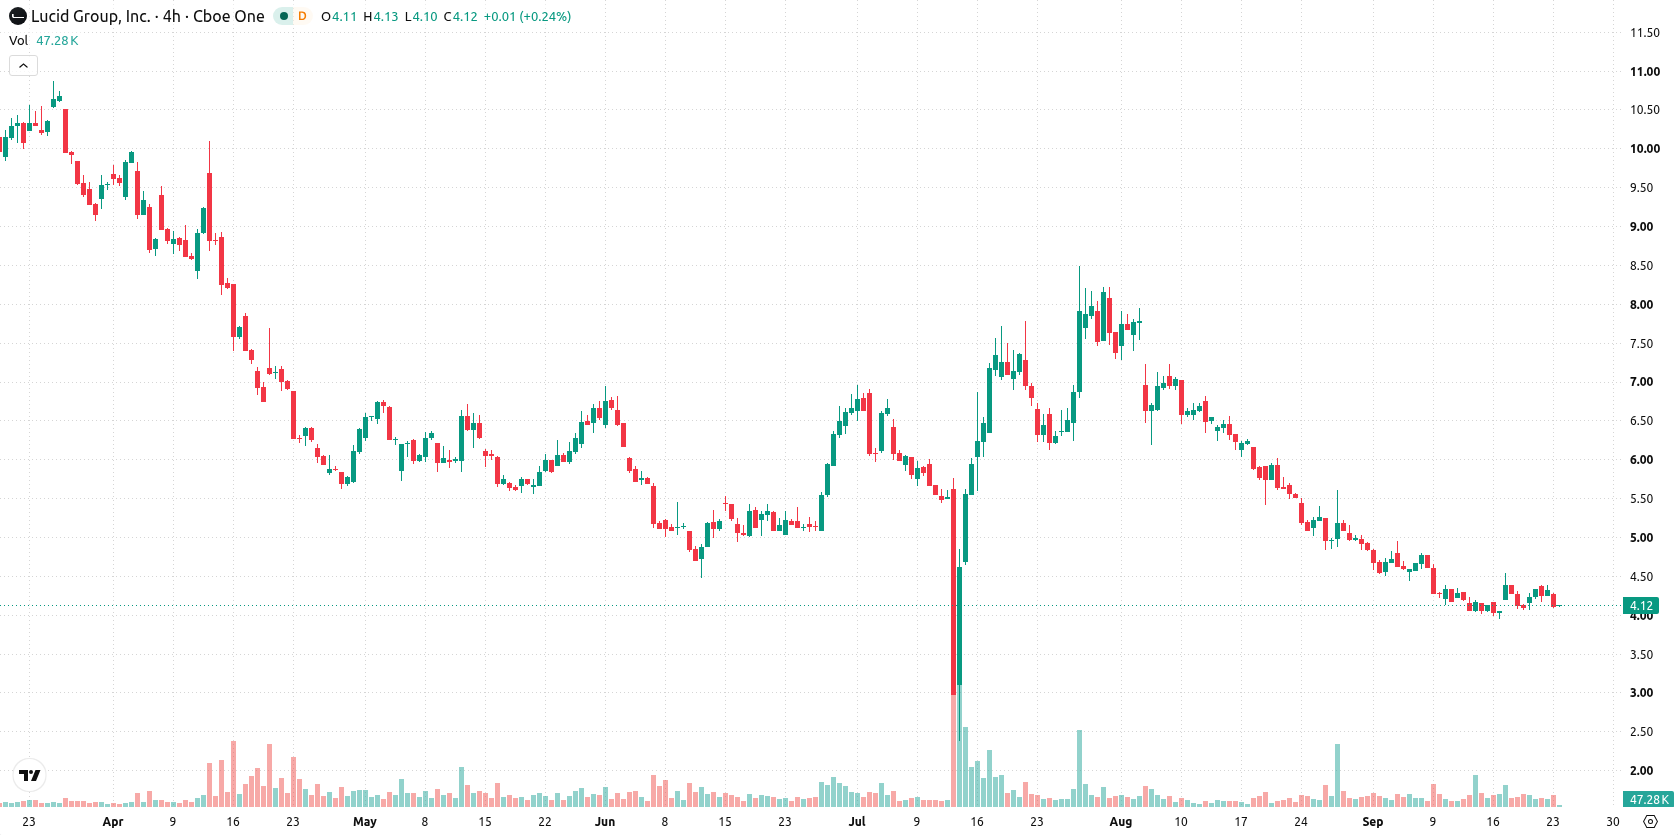
Lucid Group, Inc. (LCID) fell 4.17% as negative momentum weighed on the stock, even as recent company news pointed to new business activity. The decline is reinforced by the stock trading below all major moving averages, confirming ongoing structural weakness.
 3.11
3.59
Highlights
- Lucid Group signed a commercial agreement with Bolt as it reported $405.35 million in revenue for June 2026.
- Shares of Lucid Group experienced selling pressure with the stock down 4.17% and opening with a 4.4% downside gap.
- Lucid Group stock remains under sustained bearish momentum, trading below key moving averages with a five-day range of $3.9 to $4.38.
New deal and strong revenue guidance contrast with continued share pressure
Lucid Group signed a deal with Bolt. Revenue of $405.35 million was reported for June 2026. These developments were accompanied by broader selling pressure in the share price.
Bearish momentum reinforced as key supports fail and indicators diverge
LCID continues to face broad technical weakness, with the stock trading under its 20-day ($4.52), 50-day ($5.78), and 200-day ($8) moving averages. Resistance stands at $4.16 with nearby support at $4.09, confirming that the bearish trend persists as the 50-day average stays well below the 200-day. Technical momentum remains firmly negative: the MACD signals a strong sell, ADX highlights persistent downside pressure, and both RSI at 38.24 and CCI reflect a bearish undertone. The Stochastic RSI, however, is overbought, diverging from other indicators. Bull/Bear Power at 0 shows a tenuous balance between buyers and sellers, as intraday price action drifts toward the upper session range, despite an overall negative momentum bias.
Earlier, analysts noted that Lucid Group faced mixed technical signals, with a prevailing risk of further downside as legal and structural headwinds limited recovery prospects. The current analysis reinforces this view, as persistent technical weakness and negative momentum suggest traders should monitor the $4.09 support level for potential downside continuation.










-
 Afghanistan
-
 Albania
-
 Algeria
-
 Angola
-
 Argentina
-
 Armenia
-
 Australia
-
 Austria
-
 Azerbaijan
-
 Bahamas
-
 Bahrain
-
 Bangladesh
-
 Belarus
-
 Belgium
-
 Bolivia
-
 Botswana
-
 Brazil
-
 Brunei
-
 Bulgaria
-
 Cambodia
-
 Cameroon
-
 Canada
-
 Chile
-
 China
-
 Colombia
-
 Congo
-
 Costa Rica
-
 Cote d'Ivoire
-
 Croatia
-
 Cuba
-
 Cyprus
-
 Czechia
-
 DR Congo
-
 Denmark
-
 Dominican Republic
-
 Ecuador
-
 Egypt
-
 El Salvador
-
 Estonia
-
 Eswatini
-
 Ethiopia
-
 Finland
-
 France
-
 Georgia
-
 Germany
-
 Ghana
-
 Greece
-
 Haiti
-
 Hong Kong
-
 Hungary
-
 India
-
 Indonesia
-
 Iran, Islamic republic
-
 Iraq
-
 Ireland
-
 Israel
-
 Italy
-
 Jamaica
-
 Japan
-
 Jordan
-
 Kazakhstan
-
 Kenya
-
 Korea
-
 Kuwait
-
 Kyrgyzstan
-
 Laos
-
 Latvia
-
 Lebanon
-
 Lesotho
-
 Libya
-
 Lithuania
-
 Luxembourg
-
 Madagascar
-
 Malaysia
-
 Malta
-
 Mauritius
-
 Mexico
-
 Moldova
-
 Mongolia
-
 Montenegro
-
 Morocco
-
 Mozambique
-
 Myanmar
-
 Namibia
-
 Nepal
-
 Netherlands
-
 New Zealand
-
 Nigeria
-
 North Macedonia
-
 Norway
-
 Oman
-
 Pakistan
-
 Palestine
-
 Panama
-
 Papua New Guinea
-
 Paraguay
-
 Peru
-
 Philippines
-
 Poland
-
 Portugal
-
 Puerto Rico
-
 Qatar
-
 Reunion
-
 Romania
-
 Rwanda
-
 Saudi Arabia
-
 Serbia
-
 Singapore
-
 Slovakia
-
 Slovenia
-
 Somalia
-
 South Africa
-
 Spain
-
 Sri Lanka
-
 Sweden
-
 Switzerland
-
 Syria
-
 Taiwan
-
 Tajikistan
-
 Tanzania
-
 Thailand
-
 Trinidad and Tobago
-
 Tunisia
-
 Turkey
-
 UAE
-
 Uganda
-
 Ukraine
-
 United Kingdom
-
United States
-
 Uruguay
-
 Uzbekistan
-
 Venezuela
-
 Vietnam
-
 Yemen
-
 Zambia
-
 Zimbabwe
- Forex
- Crypto












