

Can second round of layoffs in cloud infrastructure pressure Oracle stock?

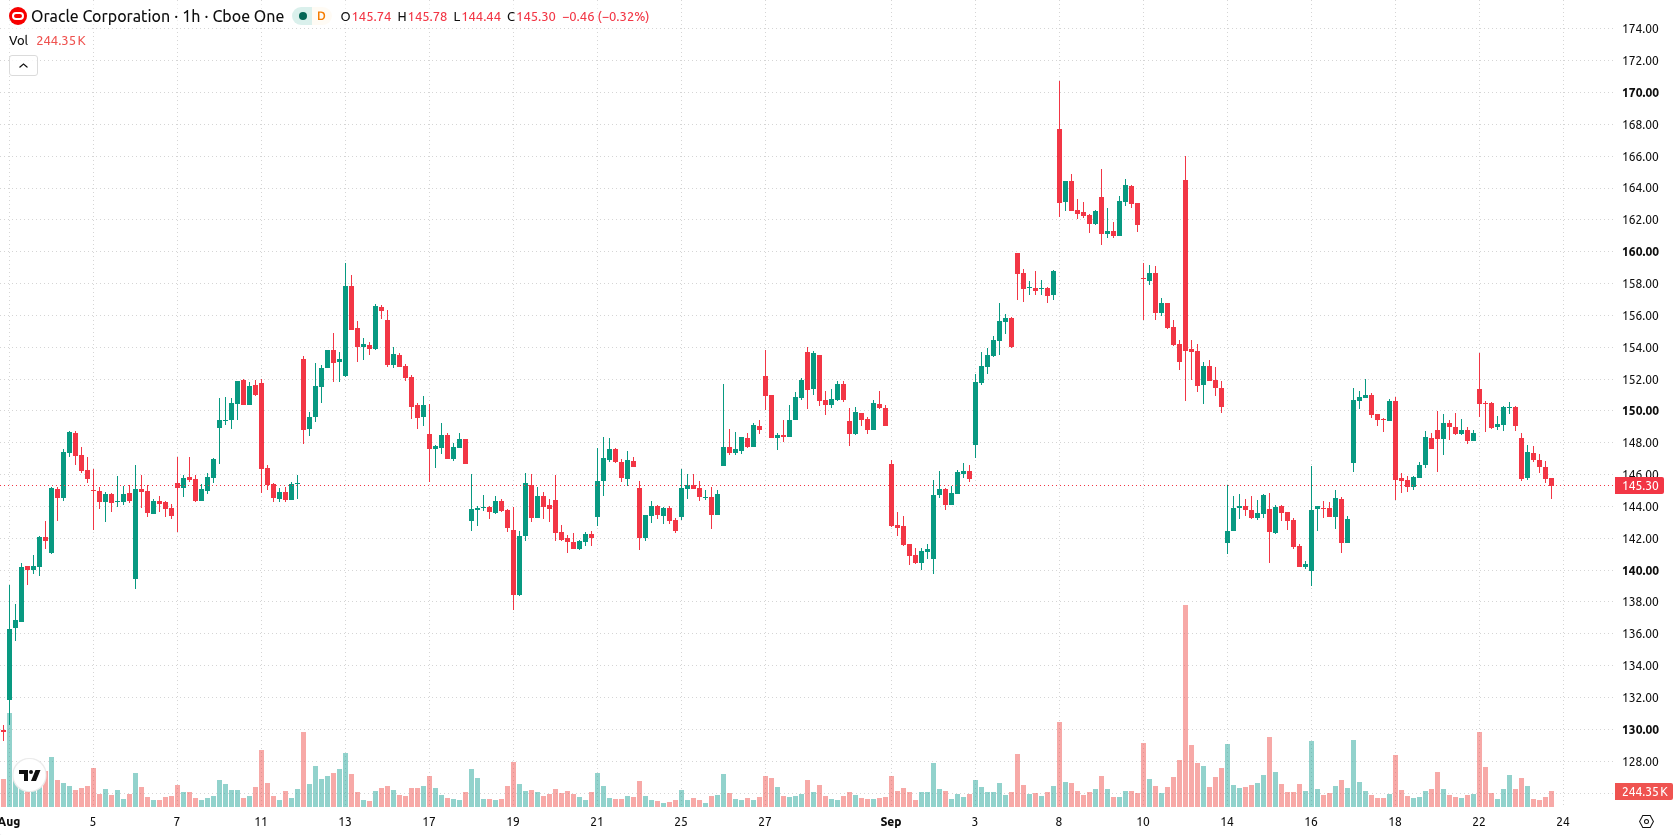
Oracle (ORCL) stock is trading at $144.53, down 3.13% for the day. The price sits below its short-, medium-, and long-term moving averages, reflecting downward momentum in the current session.
 124.89
148.40
Highlights
- Oracle reported a 30% year-over-year increase in quarterly revenue to $19.3 billion and $664 billion in remaining performance obligations.
- The company announced a new electronic health record system for cancer care, declared a $0.50 per share dividend, invested in Texas wind energy, and conducted a second round of U.S. cloud infrastructure layoffs.
- Shares of Oracle trade below key moving averages with heavy intraday selling, and are expected to consolidate between $140.48 and $148.58 over the next few days.
Revenue surge and corporate actions contrast with persistent selling pressure
Oracle reported a 30% rise in total quarterly revenues to $19.3 billion for Q1 FY27, with remaining performance obligations reaching $664 billion, highlighting robust demand and revenue visibility, according to Seekingalpha. This earnings strength was accompanied by several corporate actions, including a newly announced electronic health record system for cancer care that targets growth in specialized healthcare markets, as noted by Financial News Co. The board declared a quarterly cash dividend of $0.50 per share, and Oracle initiated a significant investment in Texas wind energy to support its AI initiatives, alongside a second round of layoffs in its U.S. cloud infrastructure unit. While these actions reflect positive operational and strategic developments, price action has remained under broader selling pressure.
Rebound capped by mixed momentum amid oversold technical signals
On the technical front, ORCL trades below the SMA-20 at $148.53, SMA-50 at $146.52, and SMA-200 at $165.68. The Ichimoku Kijun at $149 marks the nearest resistance level for any potential rebound, while support is noted around $140.48. MACD registers a Strong Buy, but ADX is Neutral. RSI reads 39.57, signaling a Sell, while Stochastic RSI, CCI, and Bull/Bear Power all indicate oversold conditions intraday. The Awesome Oscillator remains Neutral, reflecting a possible divergence as short-term momentum is mixed against a backdrop of oversold oscillators.
Directional bias limited as volatility bands frame consolidation
Looking ahead over the next 2 to 3 trading days, the anticipated price range is $140.48 to $148.58, reflecting the typical volatility band relative to current levels. There is a 30% probability of a bullish move, but the base case anticipates consolidation within the defined range. If ORCL sustains a break above $149, additional upside recovery may develop. Conversely, a drop below $140.48 could trigger a new round of downside extension.
Earlier, analysts noted that Oracle shares were in a consolidation phase driven by mixed technical signals and ongoing structural changes. The current setup builds on this view, as downward momentum persists amid key support at $140.48, making this an essential level to monitor for short-term directional cues.









-
 Afghanistan
-
 Albania
-
 Algeria
-
 Angola
-
 Argentina
-
 Armenia
-
 Australia
-
 Austria
-
 Azerbaijan
-
 Bahamas
-
 Bahrain
-
 Bangladesh
-
 Belarus
-
 Belgium
-
 Bolivia
-
 Botswana
-
 Brazil
-
 Brunei
-
 Bulgaria
-
 Cambodia
-
 Cameroon
-
 Canada
-
 Chile
-
 China
-
 Colombia
-
 Congo
-
 Costa Rica
-
 Cote d'Ivoire
-
 Croatia
-
 Cuba
-
 Cyprus
-
 Czechia
-
 DR Congo
-
 Denmark
-
 Dominican Republic
-
 Ecuador
-
 Egypt
-
 El Salvador
-
 Estonia
-
 Eswatini
-
 Ethiopia
-
 Finland
-
 France
-
 Georgia
-
 Germany
-
 Ghana
-
 Greece
-
 Haiti
-
 Hong Kong
-
 Hungary
-
 India
-
 Indonesia
-
 Iran, Islamic republic
-
 Iraq
-
 Ireland
-
 Israel
-
 Italy
-
 Jamaica
-
 Japan
-
 Jordan
-
 Kazakhstan
-
 Kenya
-
 Korea
-
 Kuwait
-
 Kyrgyzstan
-
 Laos
-
 Latvia
-
 Lebanon
-
 Lesotho
-
 Libya
-
 Lithuania
-
 Luxembourg
-
 Madagascar
-
 Malaysia
-
 Malta
-
 Mauritius
-
 Mexico
-
 Moldova
-
 Mongolia
-
 Montenegro
-
 Morocco
-
 Mozambique
-
 Myanmar
-
 Namibia
-
 Nepal
-
 Netherlands
-
 New Zealand
-
 Nigeria
-
 North Macedonia
-
 Norway
-
 Oman
-
 Pakistan
-
 Palestine
-
 Panama
-
 Papua New Guinea
-
 Paraguay
-
 Peru
-
 Philippines
-
 Poland
-
 Portugal
-
 Puerto Rico
-
 Qatar
-
 Reunion
-
 Romania
-
 Rwanda
-
 Saudi Arabia
-
 Serbia
-
 Singapore
-
 Slovakia
-
 Slovenia
-
 Somalia
-
 South Africa
-
 Spain
-
 Sri Lanka
-
 Sweden
-
 Switzerland
-
 Syria
-
 Taiwan
-
 Tajikistan
-
 Tanzania
-
 Thailand
-
 Trinidad and Tobago
-
 Tunisia
-
 Turkey
-
 UAE
-
 Uganda
-
 Ukraine
-
 United Kingdom
-
United States
-
 Uruguay
-
 Uzbekistan
-
 Venezuela
-
 Vietnam
-
 Yemen
-
 Zambia
-
 Zimbabwe
- Forex
- Crypto












