

Goodyear stock falls around 4.5% as negative technical momentum continues

Goodyear Tire & Rubber Co (GT) slumped 4.58% as persistent selling pressure and continued negative technical momentum drove the stock sharply lower. The broad bearish trend is reinforced by the stock trading below all key moving averages and intraday momentum signaling little relief for sellers.
 4.43
4.52
Highlights
- Goodyear stock is trading below key moving averages, indicating ongoing short-, medium-, and long-term selling pressure.
- Momentum indicators are bearish, with negative MACD and low RSI, confirming a strong sell signal and weak trend.
- Goodyear stock is projected to fluctuate between $4.78 and $5.42 over the next 5 days, with a 74% probability of a downward move.
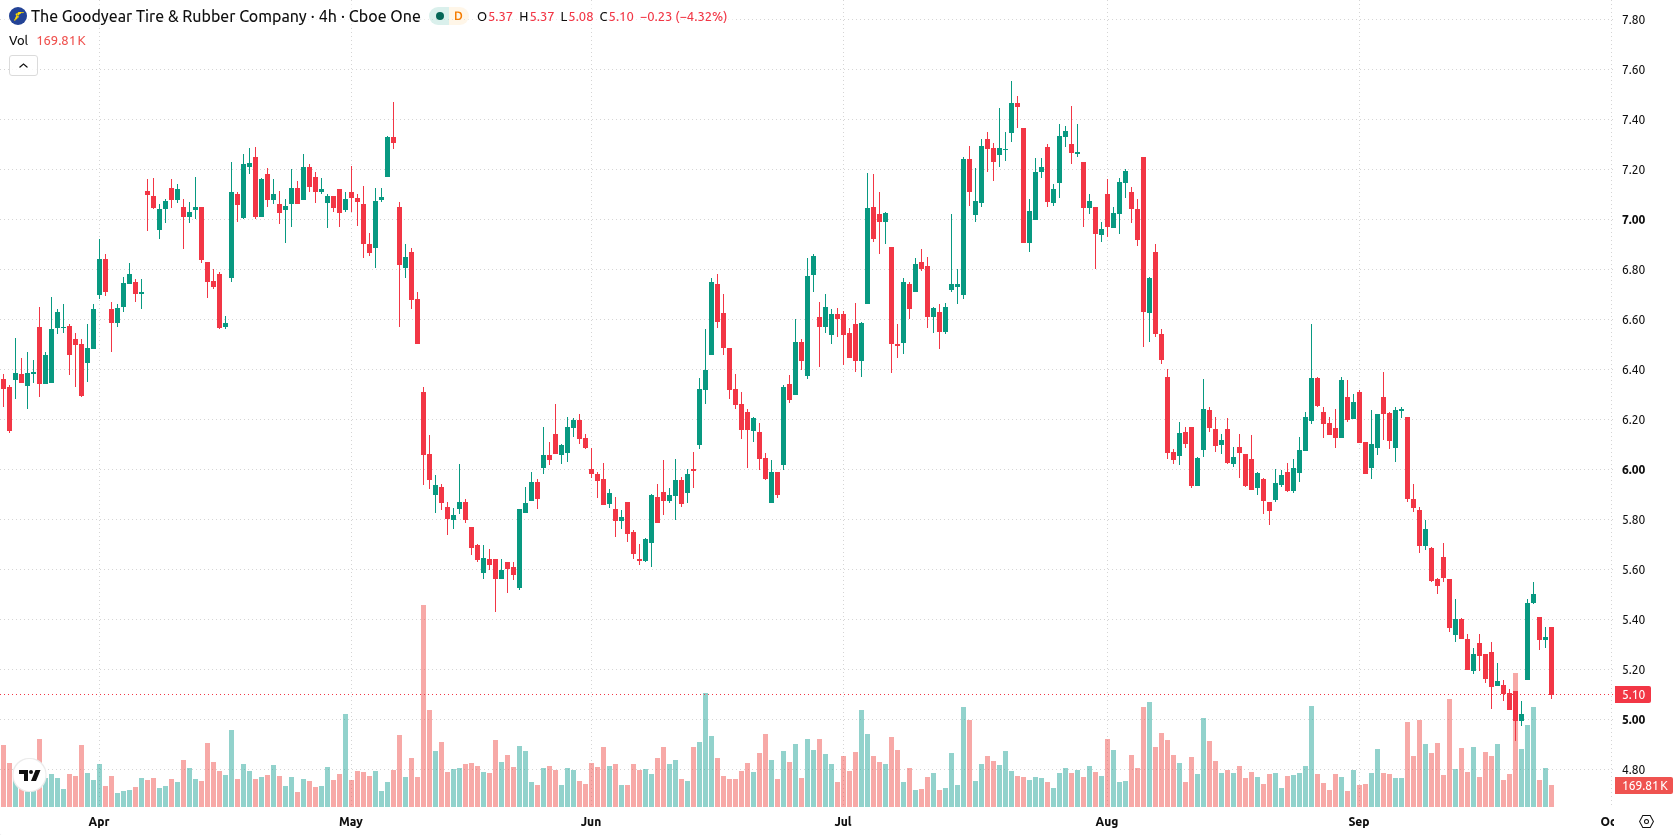
Bearish momentum reinforced as key support levels weaken
Goodyear is trading below the 20-, 50-, and 200-day moving averages ($5.69, $6.27, and $7.23), highlighting ongoing short-, medium-, and long-term pressure from sellers. The nearest ceiling is at $5.28, with support by the recent week low at $4.92. The overall alignment with the moving averages signals a prevailing bearish trend. Momentum signals are negative, with Moving Average Convergence Divergence (MACD) at -0.36 forecasting a strong sell, while Average Directional Index (ADX) at 18.44 points to a weak or neutral trend. Relative Strength Index (RSI) is moderately low at 40.49, favoring a sell, and Commodity Channel Index (CCI) is also bearish at -56.26. Stochastic RSI and Awesome Oscillator are neutral, while Bull/Bear Power (BBP) is slightly positive at 0.02, indicating buyers hold a marginal advantage intraday. Intraday momentum is mostly negative and the prevailing tone is under pressure from sellers after the open. Momentum readings generally confirm the ongoing bearish move, though BBP's mild positivity introduces some short-term divergence.
Previously it was reported that Goodyear remained under sustained bearish technical pressure, with no significant company-specific news to offset sector-driven weakness. The latest price action and momentum data further reinforce this outlook, making the $5.28 resistance and $4.92 support essential levels for traders to monitor in the days ahead.






Latest Goodyear Tire & Rubber Co News




-
 Afghanistan
-
 Albania
-
 Algeria
-
 Angola
-
 Argentina
-
 Armenia
-
 Australia
-
 Austria
-
 Azerbaijan
-
 Bahamas
-
 Bahrain
-
 Bangladesh
-
 Belarus
-
 Belgium
-
 Bolivia
-
 Botswana
-
 Brazil
-
 Brunei
-
 Bulgaria
-
 Cambodia
-
 Cameroon
-
 Canada
-
 Chile
-
 China
-
 Colombia
-
 Congo
-
 Costa Rica
-
 Cote d'Ivoire
-
 Croatia
-
 Cuba
-
 Cyprus
-
 Czechia
-
 DR Congo
-
 Denmark
-
 Dominican Republic
-
 Ecuador
-
 Egypt
-
 El Salvador
-
 Estonia
-
 Eswatini
-
 Ethiopia
-
 Finland
-
 France
-
 Georgia
-
 Germany
-
 Ghana
-
 Greece
-
 Haiti
-
 Hong Kong
-
 Hungary
-
 India
-
 Indonesia
-
 Iran, Islamic republic
-
 Iraq
-
 Ireland
-
 Israel
-
 Italy
-
 Jamaica
-
 Japan
-
 Jordan
-
 Kazakhstan
-
 Kenya
-
 Korea
-
 Kuwait
-
 Kyrgyzstan
-
 Laos
-
 Latvia
-
 Lebanon
-
 Lesotho
-
 Libya
-
 Lithuania
-
 Luxembourg
-
 Madagascar
-
 Malaysia
-
 Malta
-
 Mauritius
-
 Mexico
-
 Moldova
-
 Mongolia
-
 Montenegro
-
 Morocco
-
 Mozambique
-
 Myanmar
-
 Namibia
-
 Nepal
-
 Netherlands
-
 New Zealand
-
 Nigeria
-
 North Macedonia
-
 Norway
-
 Oman
-
 Pakistan
-
 Palestine
-
 Panama
-
 Papua New Guinea
-
 Paraguay
-
 Peru
-
 Philippines
-
 Poland
-
 Portugal
-
 Puerto Rico
-
 Qatar
-
 Reunion
-
 Romania
-
 Rwanda
-
 Saudi Arabia
-
 Serbia
-
 Singapore
-
 Slovakia
-
 Slovenia
-
 Somalia
-
 South Africa
-
 Spain
-
 Sri Lanka
-
 Sweden
-
 Switzerland
-
 Syria
-
 Taiwan
-
 Tajikistan
-
 Tanzania
-
 Thailand
-
 Trinidad and Tobago
-
 Tunisia
-
 Turkey
-
 UAE
-
 Uganda
-
 Ukraine
-
 United Kingdom
-
United States
-
 Uruguay
-
 Uzbekistan
-
 Venezuela
-
 Vietnam
-
 Yemen
-
 Zambia
-
 Zimbabwe
- Forex
- Crypto












